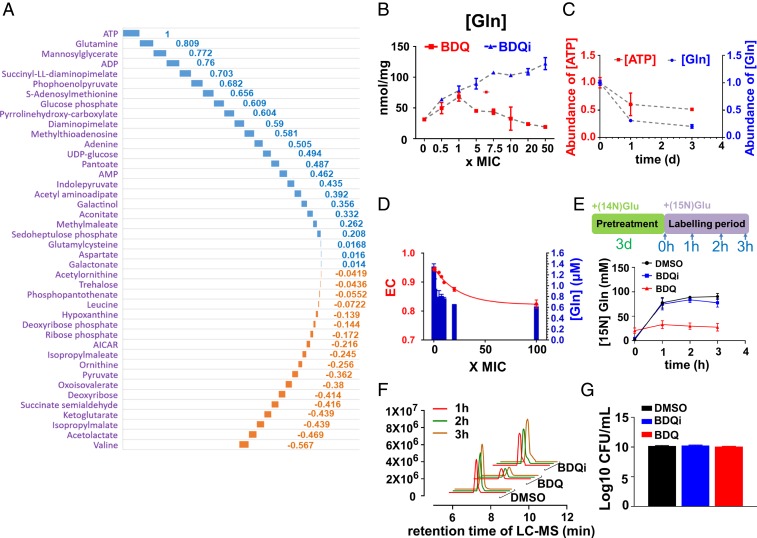
Fig. 2.
BDQ-specific linkage of ATP and glutamine levels in Mtb. (A) Waterfall plot representation of metabolic correlation network between ATP and BDQ activity-specific metabolites as determined by Pearson pairwise correlation analysis. The blue columns represent the positive correlation pairs, and the orange ones represent the negative correlation pairs. Raw correlation coefficient values are labeled at each column as well listed in SI Appendix, Table S5. (B) Intrabacterial glutamine pool sizes, expressed as nanomoles per microgram residual peptide (y axis), after exposure of Mtb to a dose range of BDQ spanning 0–50× MIC or equimolar range of BDQi concentration. (C) Overlay plot of intrabacterial ATP and glutamine levels after exposure of Mtb to BDQ at 40× MIC over time (0 to 3 d); (D) Overlay plot of BDQ treatment on the EC of viable Mtb (left y axis) and in vitro activity of Mtb GlnA1 (right y axis) in the presence of the in vitro AXP ratio corresponding to the same range of BDQ concentrations. (E) Time course of de novo glutamine synthesis after 3-d preincubation of Mtb with BDQ (20× MIC), BDQi (same range as BDQ), or vehicle control (DMSO) followed by transfer to fresh media containing [15N] glutamate and metabolic profiling at the indicated points (0, 1, 2, and 3 h). (F) The EIC for [15N] glutamine (m/z = 146.0589 [M-H]−), as in E. (G) CFU-based assay of Mtb viability after exposure of Mtb to the same range of BDQ or BDQi concentrations, as in E. All data points shown in B–G represent the average of 3 technical replicates and are representative of 2 independent experiments.

