Fig. 3.
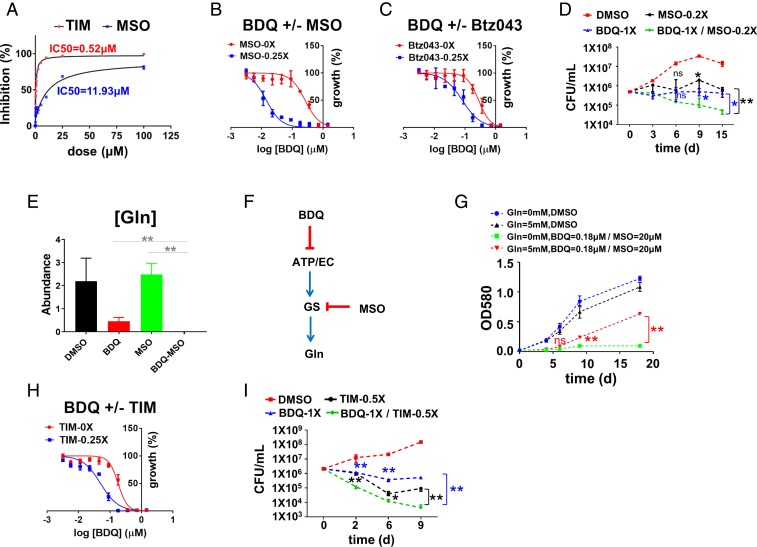
Synergistic inhibition of Mtb viability and glutamine pools by BDQ and GS inhibitors. (A) In vitro inhibition curves and IC50 values of Mtb GlnA1 by MSO (blue) and 2,4,5-TIM (red). (B, C, and H) Mtb growth inhibition curves of BDQ in the absence (red) and presence (blue) of varying concentrations of MSO (B, 0.25× MIC), Btz043 (C, 0.25× MIC), and TIM (H, 0.25× MIC). Curves depict OD580 values after 10 d incubation in 7H9 liquid medium with 0.2% glucose and 0.2% glycerol as carbon sources and drugs, as indicated; the raw values of IC50 and ΔIC50 are listed in SI Appendix, Table S6. (D) CFU-based assay of Mtb viability after exposure to MSO (0.2× MIC), BDQ (1× MIC), or the combination. (E) Total bacterial glutamine pools after exposure of Mtb to BDQ (20× MIC), MSO (1× MIC), or the combination. **P < 0.01 by unpaired Student t test. (F) Schematic depicting mechanism of synergy between BDQ and GS inhibitor, MSO. (G) Partial rescue of BDQ (0.18 µM)-MSO (20 µM) combination with exogenous (5 mM) glutamine. (I) CFU-based assay of Mtb viability after exposure to TIM (0.5× MIC), BDQ (1× MIC), or the combination. For D, E, G, and I, statistical differences were determined by unpaired t test. ns = not significant; **P < 0.01; *0.01 < P < 0.05. All data points shown in this figure represent the average of 3 technical replicates and are representative of 2 independent experiments. Error bars correspond to SEs of measurement.

