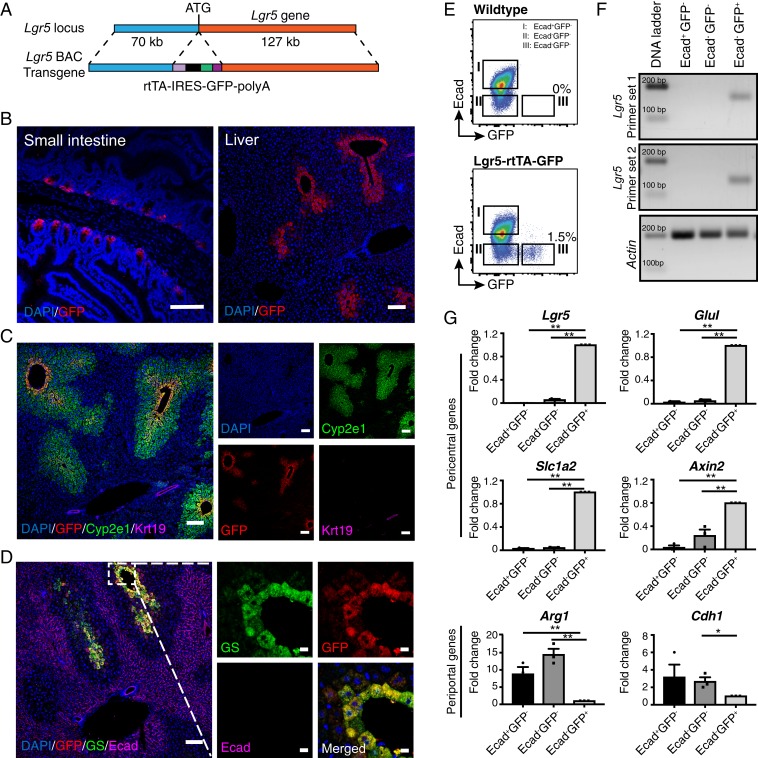
Fig. 1.
Lgr5 is expressed in a small subset of hepatocytes mostly adjacent to the central veins. (A) Schematic illustration of the transgene structure for generation of Lgr5-rtTA-IRES-GFP mouse model. The rtTA-IRES-GFP-polyA cassette was inserted in frame to replace the ATG start codon of Lgr5 gene in a BAC DNA clone containing the Lgr5 gene locus. (B) Representative confocal images showing expression of GFP in small intestine (Left) and liver (Right) of adult Lgr5-rtTA-IRES-GFP transgenic mice. (C) Representative confocal images showing costaining of GFP with the pericentral hepatocyte marker Cyp2e1 and bile duct marker Krt19. (D) Representative confocal images depicting that the Lgr5-GFP+ population largely overlaps with the GS-expressing hepatocytes at the thin rim surrounding the central veins and is mutually exclusive to the cells marked by Ecad. (E) Representative FACS plots showing mutual exclusive presence of Lgr5-GFP+ hepatocytes and Ecad+ hepatocytes in adult WT and Lgr5-rtTA-IRES-GFP transgenic mice. (F) Representative gel images showing the expression of endogenous Lgr5 was restricted in the Lgr5-GFP+ hepatocytes. Three subsets of hepatocytes defined by Lgr5-GFP and Ecad expression were FACS sorted and two independent sets of primers targeting different exons of the Lgr5 gene were used for PCR amplification. (G) qPCR analysis of expression of periportal and pericentral genes in the three subsets of hepatocytes defined by Lgr5-GFP and Ecad expression. FACS isolated hepatocytes for each subpopulation were pooled from three mice to procure sufficient total RNA for qPCR analysis. Three independent experiments were conducted for qPCR analyses. *P < 0.05; **P < 0.01. Error bars represent mean ± SEM. (Scale bars: B, C, and D, Left, 100 μm; D, Right, 10 μm.)

