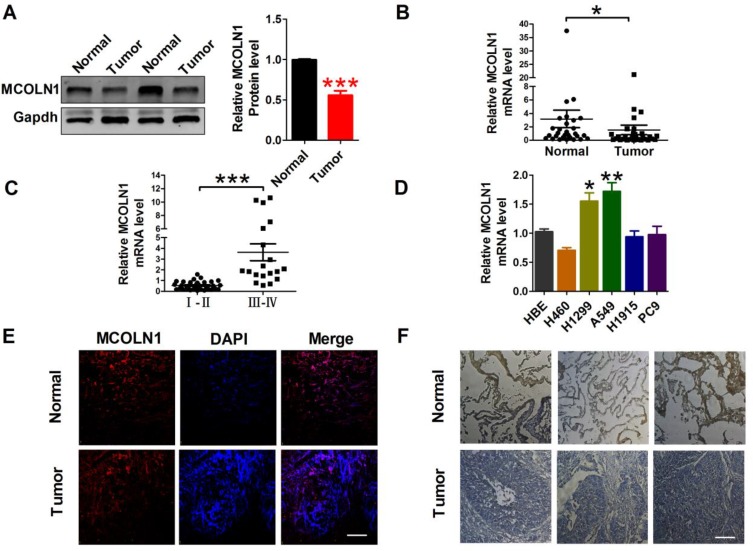
Figure 1.
MCOLN1 expression in NSCLC tissues and cell lines. (A) The expression of MCOLN1 was analyzed by Western blot. ***P<0.001 vs normal. (B, C) The relative quantities of MCOLN1 mRNA in both NSCLC tissues and normal lung specimens were detected by qRT-PCR. *P< 0.05, ***P<0.001 vs normal or I–II stage group. (D) Expression levels of MCOLN1 mRNA in NSCLC cell lines and normal bronchial epithelial cells (HBE) were determined by qRT-PCR. *P<0.05, **P<0.01 vs HBE. (E) Immunofluorescence images (×400) showed the expression of MCOLN1 in normal lung specimens (control) and NSCLC tissues. blue: nuclear staining (DAPI); red: MCOLN1 staining; violet: merged images. (F) MCOLN1 expression of consecutive sections of lung specimens in control and NSCLC tissues assessed by immunohistochemical staining. Scale bar indicates 100 μm. Data are presented as the mean±SEM.

