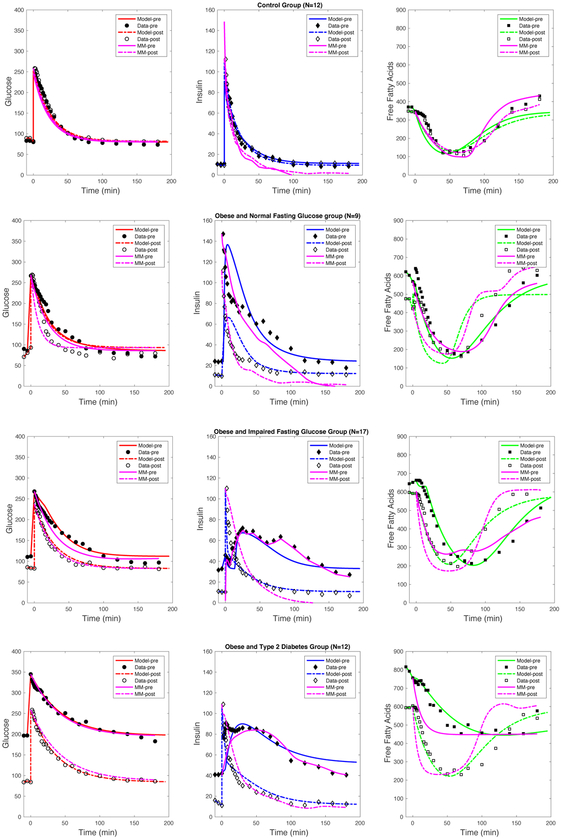
Figure 3.
Numerical simulations for Model (2.1) and (2.2) are fit to the data for parameters summarized in Tables 2 and 3, respectively. A description of estimated values for both models can be found in Table 6. Simulations for Model (2.1) are presented (in pink) and Model (2.2) glucose (in red), insulin (in blue), and FFA (in green) for all clinical data.

