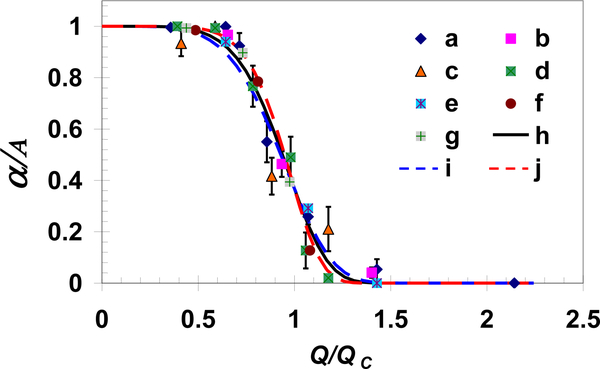
Fig. 7.
All measured and simulated normalized capture ratios as a function of the normalized flow rate collapse onto a single exponential function presented in Equation 4. Experimental data sets ‘a’, ‘b’, and ‘c’ are for MDA-MB-231 cells in a channel coated with EpCAM antibodies at concentrations of 100, 10, and 1μg/ml, respectively, while ‘d’ is for BT-20 cells in a channel coated with EpCAM antibodies at a concentration of 100μg/ml; data sets ‘e’, ‘f’ and ‘g’ are calculations for cell receptor densities of 5.4×10⁸, 6.4×10⁹ and 1.6×10¹⁰/cm2, respectively, with ligand density of 4.0×10¹⁰/cm2; and curves ‘h’, ‘i’ and ‘j’ are exponential functions with exponents B=6±1.

