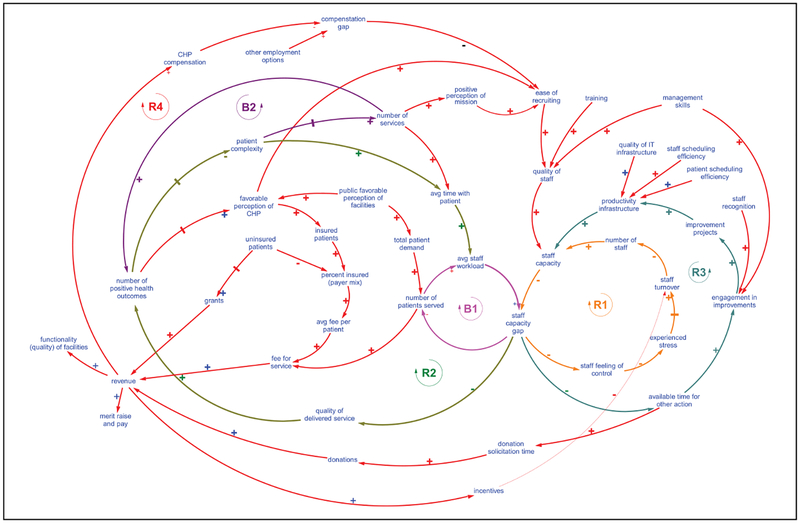
Figure 1.
The final closed-looped causal diagram of critical variables at CHP.
Note. Identifying causal relations among the variables produced by the affinity diagram. As above, a + sign indicates positive polarity (i.e., positive partial derivative) of a causal relationship (a change in the cause variable creates a change in the same direction in the effect variable), all else being equal, and a − sign indicates a negative polarity (i.e., negative partial derivative) of the causal relationship (a change in the cause variable creates a change in the opposite direction in the effect variable), ceteris paribus. CHP = Community Health Partners.

