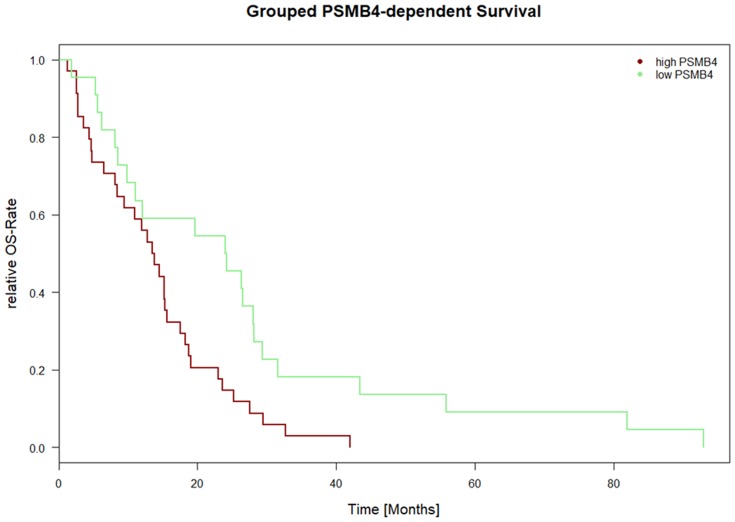
Figure 2.
PSMB4 expression-dependent survival for TCGA/cBioPortal data. Figure 2 depicts the Kaplan–Meier curve for PSMB4expression-dependent survival. On the x axis, the time is depicted in days. On the y axis, the number of events is shown in percentage. PSMB4 and outcome showed a correlation with respect to the COXPH model (all tests; p<0.0175; CI 95%: 4.45e+11 to 3.05e+115). The data were derived from the “Mesothelioma” dataset from TCGA/cBioPortal (n=87 patients, survival data was available for n=56 patients). All other proteasomal subunits showed no correlation with survival.

