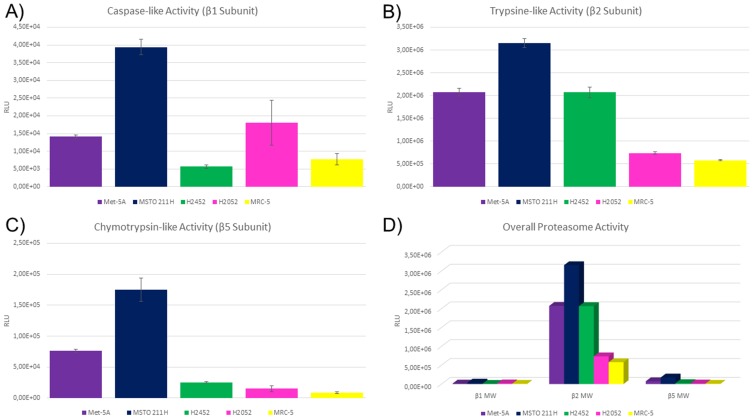
Figure 3.
Proteasome subunit activity in mesothelial and fibroblast cell lines. Figure 3 shows relative luminescence units on the y axis. Higher values indicate higher activity of the respective subunit. On the x axis, the investigated cell lines are depicted. Each subunit was measured six times per cell line and error bars indicate the deviation (A–C). Met-5A and MSTO-211H showed elevated activity compared to the other cell lines. (D) Summarizes the correlated results for the subunit activity and respective cell lines. Error bars were spared to enhance the readability.

