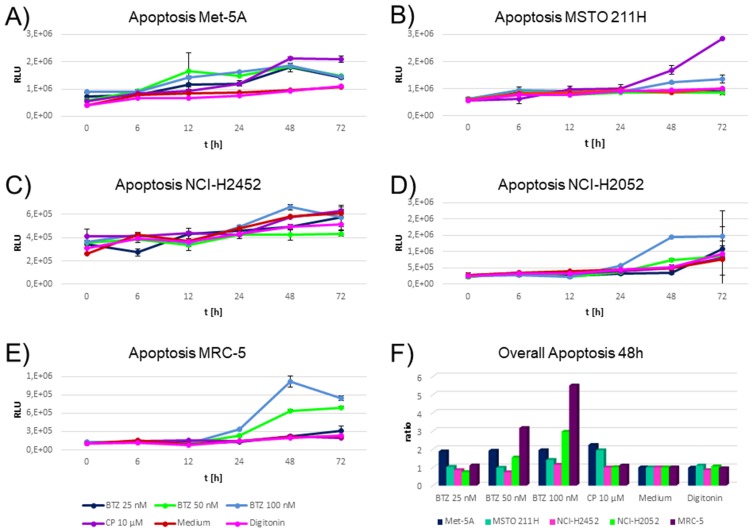
Figure 4.
Time-dependent induction of apoptosis in cell lines during incubation with cytostatics and medium. (A-E) shows relative luminescence units on the y axis. Higher values indicate higher caspase 3/7 activity indicating a higher apoptotic rate. The x axis depicts the time points investigated. The different colors indicate the cytostatics applied as explained in the figure legend. BTZ abbreviates bortezomib and CP cisplatin. Triplicates were measured per drug, time point and cell line. Highest induction of apoptosis by bortezomib was monitored for cell lines NCI-H2052 and MRC-5 (D–E). These cell lines were not influenced by cisplatin. Met-5A (A) responded similar to all cytostatics. MSTO-211H showed an elevated induction of apoptosis for cisplatin, but a negligible response to all other drugs and concentrations (B). NCI-H2452 showed a slight response to the highest concentration of bortezomib (100 nM) only (Figure 3C). (F) An optimal time point for each cell status assay was calculated by taking the cells incubated with medium as the baseline and calculating a ratio of the other compounds compared to cells with the medium. The optimal time point was 48 hrs after incubation. On the y axis, the normalized apoptosis ratios for each cell lines are shown. High responses for bortezomib 50 nM and 100 nM were found for MRC-5 and NCI-H2052 only.

