Figure 6.
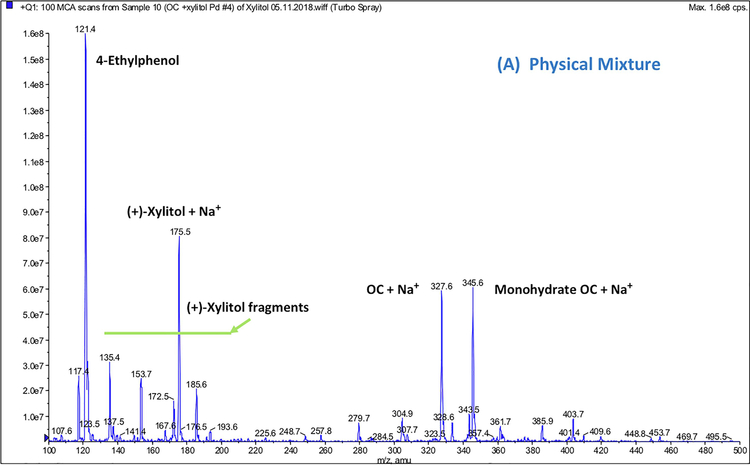
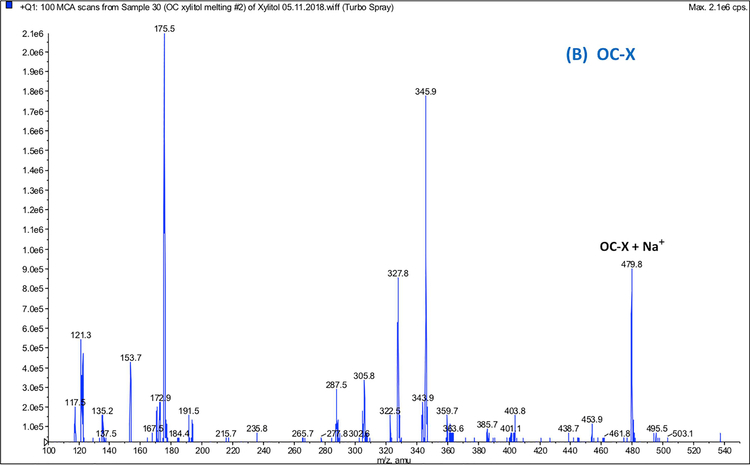
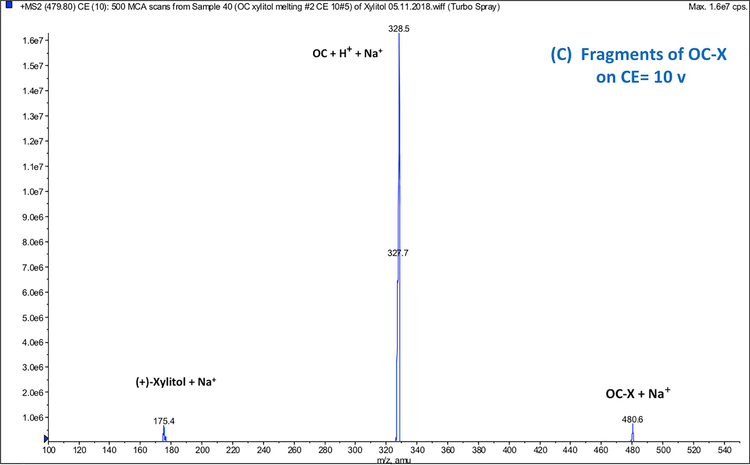
Full scan Q1 mass spectra of: (A) PM showing ion peaks for individual OC and xylitol, (B) OC-X 1:7 SD showing the molecular ion peak of the OC-xylitol complex Na adduct at m/z 479.8, (C) ESI-MS-MS Q2 fragmentation product ions of the OC-xylitol complex Na adduct at m/z 480.6 to individual OC and xylitol Na adducts at collision energy 10V.


