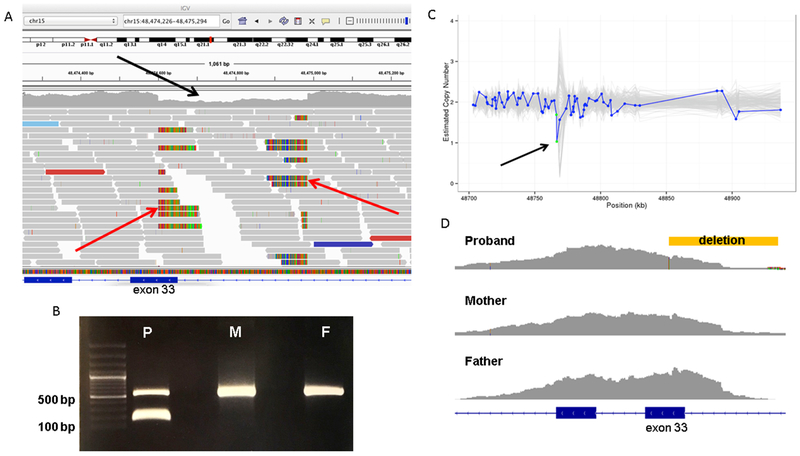
Figure 2.
A, The patient’s deletion as visualized in the Integrated Genomics Viewer using his genome sequencing data. Aligned reads are shown as gray horizontal bars and an area of relative depletion is seen where the deletion occurs (black arrow), overlapping exon 33, with the split reads highlighting the breakpoints (red arrows). B, Primers were designed to yield a 548-bp amplicon surrounding the region of the patient’s (P) deletion within FBN1 at chr15:48474600-48474985. This deletion of 385 bp would yield a 163 bp amplicon in the variant allele. Both the patient’s mother (M) and father (F) data revealed homozygosity for wild-type FBN1 without this deletion, indicating that the patient has a de novo variant. C, Germline Copy Number Variant caller results from the patient’s exome data demonstrating relative depletion in the area of the deletion (arrow). The y-axis denotes the copy number as inferred by Germline Copy Number Variant caller and the x-axis shows the position along the gene in kilobases. The blue line represents the sample of interest and the grey lines represent the other samples in the same batch of CNV calling. Each blue dot on the plot represents a probe for exon capture, which roughly represents exons. The green dots in this plot represent 2 probes that span exon 33. (The copy number estimation is expected to hover around 2.0 for autosomes.) D, Exome data for the trio as seen in Integrated Genomics Viewer revealed lower coverage for the affected child (proband) surrounding exon 33. The location of the deletion is demonstrated by the yellow bar.

