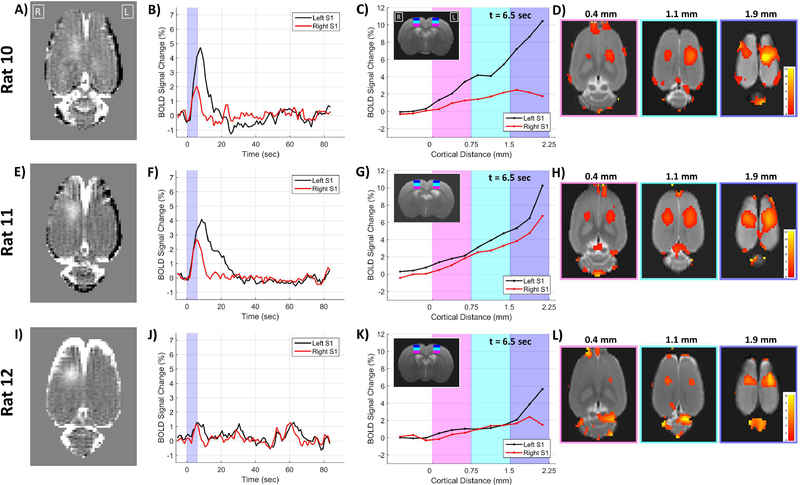
Figure 8: Cortical depth BOLD results.
Individual results from three rats are shown in the three rows. The first column shows the T1-weighted contrast difference image of the BBB opening. The second column plots the BOLD signal change time courses for the left and right S1 regions. The third column plots the BOLD changes at 6.5 seconds after stimulus onset as a function of cortical depth. The locations of the shaded magenta, cyan and blue regions on the plots are shown on the T2-weighted anatomical image inset. The fourth column shows maps of BOLD signal from 6.5 seconds after stimulus onset at three different cortical distances from white matter.

