

Abstract
Gastrointestinal and mental disorders are highly comorbid, and animal models have shown that both can be caused by early adversity (e.g., parental deprivation). Interactions between the brain and bacteria that live within the gastrointestinal system (the microbiome) underlie adversity-gastrointestinal-anxiety interactions, but these links have not been investigated during human development. In this study, we utilized data from a population of 344 youth (3–18 years old) who were raised with their biological parents or were exposed to early adverse caregiving experiences (i.e., institutional or foster care followed by international adoption) to explore adversity-gastrointestinal-anxiety associations. In Study 1, we demonstrated that previous adverse care experiences were associated with increased incidence of gastrointestinal symptoms in youth. Gastrointestinal symptoms were also associated with concurrent and future anxiety (measured across 5 years), and those gastrointestinal symptoms mediated the adversity-anxiety association at Time 1. In a subsample of children who provided both stool samples and functional magnetic resonance imaging of the brain (Study 2, which was a “proof-of-principle”), adversity was associated with changes in diversity (both alpha and beta) of microbial communities, and bacteria levels (adversity-associated and adversity-independent) were correlated with prefrontal cortex activation to emotional faces. Implications of these data for supporting youth mental health are discussed.
Keywords: anxiety, development, functional magnetic resonance imaging, gastrointestinal distress, microbiome
Gastrointestinal and mental health problems are highly comorbid. For example, anxiety is five times higher in individuals with irritable bowel syndrome (IBS) than in those with no IBS symptoms, and among anxiety sufferers, rates of IBS (and other functional gastrointestinal disorders) are increased fourfold (Lee et al., 2009; Mak et al., 2012), possibly reflecting a mechanistic association. Several studies in adults have shown support for a bidirectional relationship between mental illness and gastrointestinal disorders such as IBS. For example, in a population of healthcare seekers, anxiety and depression diagnoses preceded IBS diagnoses by approximately 3.5 years (Jones et al., 2017), and experimental studies have shown that psychosocial stress can increase IBS symptoms (Williams, Villar, Peterson, & Burks, 1988), supporting the pathway of psychological to gastrointestinal (GI) dysfunction. The opposite pathway of influence (GI to psychological dysfunction) also has strong support in the literature. For example, in a prospective cohort study, IBS was shown to precede mood disturbances in over 60% of cases, whereas mood disturbance preceeded IBS in only 30% of cases (Koloski, Jones, & Talley, 2016). Such bidirectional associations may be indicative of a causal relationship between each symptom group, and/or may be reflective of a shared etiology.
Research has consistently shown that exposure to early life adversity is a potent risk factor for both GI and mental illnesses. Rats exposed to parental-deprivation stress exhibit increased IBS symptoms (i.e., visceral hypersensitivity) as well as elevated levels of anxiety at postweaning age, and into adulthood, compared to nondeprived peers (Yi et al., 2017). In humans, early adversity ( particularly in the late postnatal period) is associated with up to a threefold increase in risk of irritable bowel symptoms (Bradford et al., 2012; Chitkara, van Tilburg, Blois-Martin, & Whitehead, 2008; Klooker et al., 2009; Park et al., 2016), and contributes to over a third of lifetime mental illness diagnoses (Green et al., 2010; McLaughlin et al., 2010; Repetti, Taylor, & Seeman, 2002), as well as subthreshold and clinical levels of anxiety in children (Goff et al., 2013; Wiik et al., 2011). Such adversities also impact neurobiology implicated in affective responding and irritable bowel symptoms. In the rodent, early caregiving adversities alter prefrontal, amygdala, and hippocampal development (Roceri et al., 2004), change cognitive and emotional behaviors that are supported by those neural structures (Callaghan & Richardson, 2012, 2014; Cowan, Callaghan, & Richardson, 2013), as well as lead to increased visceral pain responses and elevated activation of the prefrontal cortex and amygdala when experiencing such pain (Felice et al., 2014). Similarly, in humans, caregiver neglect, or its more potent form, early institutional care (which is characterized by parental deprivation, and is a significant risk factor for anxiety symptoms), is followed by a heightened risk for atypical prefrontal cortex and amygdala functional and structural development, prefrontal cortex connectivity, amygdala reactivity, and changes in default resting state networks (Bick et al., 2015; Callaghan et al., in press; Gee, Gabard-Durnam, et al., 2013; Hanson et al., 2013; Hodel et al., 2015; Maheu et al., 2010; Silvers et al., 2016; Tottenham et al., 2010; Van der Werff et al., 2013). Those neural targets overlap with the hubs of dysregulated neural activity seen in adult IBS sufferers (Mertz et al., 2000).
While clear links have been drawn between gastrointestinal and psychiatric symptoms across the life span (Garber, Zeman, & Walker, 1990; Rajindrajith et al., 2014; Shelby et al., 2013), the role of early adversity in increasing vulnerability to functional gastrointestinal complaints is only established in adults, with examinations in childhood almost nonexistent (but see Rajindrajith et al., 2014). Hence it is unclear when in life such associations emerge. This is a critical gap in the literature, as early detection of such associations could lead to early intervention. In a previous study, approximately 80% of children and adolescents (5–18 years) who were presenting to a primary care physician with recurrent abdominal distress (which includes gastrointestinal disturbances) had comorbid psychopathology (with anxiety being the most common diagnosis; Campo et al., 2004). Considering that GI distress is such a common presentation for youth in primary care settings (McFerron & Waseem, 2012), identifying how it relates to early adversity exposure, and whether it is associated with concurrent and future anxiety could help to identify a high-risk target group for early interventions. As the median age of anxiety onset is 11 years (Kessler et al., 2005), and adversity effects on anxiety and related neurocircuitry have been detected in children under 10 years (e.g., Gee et al., 2013), it is likely that associations between adversity, anxiety, and GI complaints will be detected during childhood, but this has not been empirically tested. We sought to establish such associations in the current study.
Building a mechanistic understanding of the pathways through which adversity might affect both GI and anxiety symptoms is an important step toward improving outcomes following early adversity. In that regard, one important biological factor to consider is the gastrointestinal microbiome. The gastrointestinal microbiome, which is composed of a constellation of bacteria, archaea, fungi, and viruses, is essential for virtually all aspects of gastrointestinal function, from digestion and motility to inflammation and disease (Ursell, Metcalf, Parfrey, & Knight, 2012). The GI microbiome is increasingly recognized as important for brain function and mental health, and vice versa. For example, GI bacteria produce neurochemicals that are essential for brain function and emotional behaviors, such as T-aminobutyric acid, short chain fatty acids, and, 5-hydrox ytryptophan (the biological precursor to serotonin), which then reach the central nervous system (CNS) through humoral and vagal nerve pathways (bidirectional communication channels between the brain and gut; Cryan & Dinan, 2012). In addition, the microbiome influences immune and inflammatory pathways (Belkaid & Hand, 2014) that are directly associated with anxiety and depression (Vogelzangs, Beekman, de Jonge, & Penninx, 2013; Vogelzangs, de Jonge, Smit, Bahn, & Penninx, 2016), and manipulations of such bacteria have been shown to influence anxiety levels in adult humans (Collins, Kassam, & Bercik, 2013; Lyte, Li, Opitz, Gaykema, & Goehler, 2006; Messaoudi et al., 2011), as well as fear behaviors in developing rodents (Callaghan, Cowan, & Richardson, 2016; Cowan, Callaghan, & Richardson, 2016).
When considered in the context of development, the role of the gastrointestinal microbiome in mental health is particularly pertinent, as there may be a sensitive period for microbiome-dependent maturation of the CNS. Rodent models using animals that were born and raised germ free have identified a causal role of GI bacteria in CNS maturation. In particular, disrupted development of several neural networks with known roles in emotional functioning, including the amygdala, prefrontal cortex, and hippocampus, have been observed in germ-free animals (Hoban et al., 2016, 2017, 2018; Ogbonnaya et al., 2015), aberrations that can be lifelong if microbial reconstitution does not occur before adolescence.
Beyond germ-free conditions, the early psychosocial environment also shapes microbiome maturation during sensitive developmental windows. For the microbiome, this period of maximally enhanced sensitivity to environments appears to extend from birth to around the fourth year of life, with both the overall numbers of species represented in the gut and their taxonomic relation to adult bacteria increasing dramatically across this time frame (Yatsunenko et al., 2012). Thus, it seems that, like the brain, the young microbiome is particularly vulnerable to environmental perturbation during this early stage of developmental plasticity. Rodent and monkey models have shown that early caregiving adversity (e.g., maternal separation) significantly alters microbial communities across the life span (Bailey & Coe, 1999; Gareau, Jury, MacQueen, Sherman, & Perdue, 2007). Moreover, interventions that directly alter microbial communities (e.g., probiotics), if performed early enough, can reverse the effects of early adversity on affective behaviors (threat learning and extinction), anxiety phenotypes, and the brain (hippocampus and prefrontal cortex; Ait-Belgnaoui et al., 2014; Bravo et al., 2011; Callaghan et al., 2016; Cowan et al., 2016; Waworuntu et al., 2014) in rodent models, suggesting the microbiome might be a treatment target for anxiety in adversity-exposed populations.
The most likely pathway linking microbiome and mental health is via an influence over CNS functioning. However, there is currently no evidence of brain-gut bacteria associations in middle childhood, or following adversity. In addition, it is not clear whether adversity is associated with GI symptoms in middle childhood, which would be important to establish if we are to identify children who would most likely benefit from gastrointestinal manipulations. Here we present the results of two studies, which together provide evidence for the utility of examining the brain-gut-microbiome axis in affective functioning following early adversity. In Study 1, we test whether adversity is associated with GI complaints in a large sample of youth aged 3–18 years. Then, we establish whether GI complaints, which are a common reason for presentation at primary care clinics, are associated with concurrent anxiety, and are predictive of future anxiety, validating clinical utility of examining GI complaints for detecting anxiety risk. In Study 2, which occurred in a smaller convenience sample taken from the larger Study 1 population, we establish proof-of-concept for microbiome-brain associations in middle childhood, following adversity, paving the way for future investigations to explore this mechanistic pathway across development using currently available techniques (e.g., functional neuroimaging).
Study 1: Associations of Adversity With Gastrointestinal Complaints and Anxiety
Method
Participants
Participants were children and adolescents who had either been exposed to early adverse (EA) caregiving experiences (i.e., institutional care, N = 103, or foster care, N = 12, total EA N =115, followed by international adoption into families), or who had been raised with their biological families without any report of adverse caregiving (comparison group; COMP, N = 229). Institutional care is a significant deviation from species-expected caregiving experiences (e.g., high infant:caregiver ratios; Gunnar, Bruce, & Grotevant, 2000; van Ijzendoorn et al., 2011) representing a potent stressor for the infant. Foster care, although often representing a vast improvement from institutional care settings (depending on the quality of caregiving), nonetheless involves a significant disruption in caregiving and is also associated with elevated risk for emotional difficulties in children (Brand & Brinich, 1999; Van Den Dries, Juffer, van IJzendoorn, Bakermans-Kranenburg, & Alink, 2012; Zeanah et al., 2009). Thus, we analyzed the data provided by those children as one group of EA youth, although the majority of the EA sample had experienced institutional care. Upon enrollment, the parents of comparison youth reported no child/adolescent psychiatric diagnoses, and as a group they scored in the average range on the Child Behavior Checklist (CBCL; mean = 44.87, SD =10.44; Achenbach, 1991). Inclusion criteria for all youth (N = 344) were that parents completed the CBCL and Revised Children’s Anxiety and Depression Scale—Parent version (RCADS-P) for a baseline assessment of GI symptoms (Time 1).
The sample used in Study 1 was gathered from two projects that were being completed in the laboratory at the same time. As the measures used in this study were collected across both projects, we included participants from both projects in the current study. In one of those projects, N = 234 participants (ages 4–18 years old) were enrolled in a longitudinal imaging study, aiming for a longitudinal sample target of N =130 participants to receive two visits, and N =65 to receive three visits (depending on entry date; i.e., not all participants were actually intended for follow-up). Participants were overenrolled at Time 1 in order to reach follow-up recruitment goals given the anticipated difficulties in scanning this age range (e.g., braces, motion artifact, refusal, and scheduling). Thus, this sample provided N= 234 participants with Time 1 data, out of which N =117 participants also provided anxiety symptom data at either two (N =114 [COMPS N = 69, EA N =45]; i.e., 88% of N =130 targeted for follow-up assessment) or three (N =60 [COMPS N =33, EA N =27]; i.e., 92% of N= 65 targeted for follow-up assessment) time points. For the current analysis, we counted the first time point at which participants had provided reports of gastrointestinal symptoms (via RCADS-P and CBCL items) as their Time 1 assessment, independent of the visit in which those data had been collected. If participants provided more than one time point of anxiety symptom data, those were labelled Time 2 (Time 1 + 2 years) for the second time point, and Time 3 (Time 1+4 years) for the third time point. In addition to those N =234 youth, another N =110 preschoolers (aged 3–6 years old) were recruited for a separate single time point study that examined emotional learning (these data were included in the Time 1 assessment for the current study). Hence, for the current study, the Time 1 assessment included a total of 344 participants between the ages of 3 and 18 years old (COMP N =229, 120F/109M; EA N =115, 75F/ 40M; see Table 1 for demographics). Across both of the past projects, recruitment of participants occurred through local birth records, local classifieds, international adoption agencies, family networks, posted flyers, and friend referral.
Table 1.
Demographic information stratified by caregiving history for Study 1 (rows 2 and 4) and Study 2 (rows 3 and 5)
| Rearing history |
Number of females/ males |
Mean IQ (SD) |
Racial/ethnic background/ country of origin (n) |
Mean age in years, SD, range |
Mean interval years scan-microbiome sample (range) (Study 2 only) |
Mean SCARED-P anxiety score, SD |
Mean age at adoption (years; range) |
Mean time with adoptive family (years) at time of microbiome sample (range) (Study 2 only) |
||
|---|---|---|---|---|---|---|---|---|---|---|
| Gastrointestinal/ anxiety assessment (Study 1 only) |
MRI scan (Study 2 only) |
Microbiome sample (Study 2 only) |
||||||||
|
| ||||||||||
| COMP (Study 1) (N = 229) | 120/109 | 111.80 (16.45) |
Asian American (34), African American/Black (48), Native Hawaii or Other Pacific Islander (5), American Indian Alaskan Native (2), European American/Caucasian (119), multiple (20), other (1) | 7.93, 4.30, 3–18 | — | — | — | 0.26 (0.21) | — | — |
|
| ||||||||||
| COMP (Study 2) (n = 8) | 7/1 | 125.57 (23.77) | Asian American (2), African American/Black (1), European American/ Caucasian (5) | — | 7.76,1.74,5–11 | 11.47, 1.6,9–14 | 3.68 (2.83–4.42) | 0.39 (0.18) | — | — |
|
| ||||||||||
| EA (Study 1) (N =115) | 75/40 | 103.35 (16.93) |
Azerbaijan (2), Belarus (1), China (38), Guatemala (5), Hungary (1), India (3), Kazakhstan (15), Korea (3), Romania (1), Russia (29), Slovak Republic (1), South Korea (6), Taiwan (1), Tanzania (1), Ukraine (5), Vietnam (2), no information (1) | 9.35, 3.70, 3–18 | — | — | — | 0.48 (0.33) | 2.11 (0–14) | — |
|
| ||||||||||
| EA (Study 2) (n = 8) |
5/3 | 102.25 (14.24) |
Azerbaijan (1), China (3), Kazakhstan (2), Russia (2) | — | 8.79, 1.42, 7–11 |
12.98, 1.73, 10–15 | 4.23 (3.67–5.00) | 0.59 (0.19) | 2.73 (0.837.00) | 10.25 (7.42–13.08) |
|
| ||||||||||
| p-value difference between COMP and EA for Study 1 | .028 | .0002 | — | .002 | — | — | — | <.0001 | ||
|
| ||||||||||
| p-value difference between COMP and EA for Study 2 | .248 | .036 | — | — | .215 | .093 | .039 | .045 | — | — |
Note: Country of origin is listed for the early adversity (EA) sample, whereas race is listed for the US-born comparison sample. Sex distribution; mean IQ (SD); mean age in years (and range) at the time of the scan, at the time of the gastrointestinal/ anxiety assessment, at MRI scan, and microbiome sample, and the interval between the scan and sample; as well as mean (SD) anxiety score on the Screen for Child Anxiety Related Disorders—Parent version (SCARED-P) at baseline, are listed separately for each group. Statistical significance of group differences between caregiving conditions for Study 1 and 2 are presented in the bottom two rows. Mean age in years (and range) at the time of adoption and years with the adoptive family by the time of stool sample are listed for the EA group only.
The Wechsler Abbreviated Scale of Intelligence provided estimated IQ for participants over 6 years of age (data available on N = 232). Mean levels of measured intelligence were average for both groups (COMP: mean ± SD = 111.48 ± 16.45; IA: mean ± SD = 103.35 ± 16.93) but were significantly higher in the comparison youth than in children who were internationally adopted (controlling for participant sex), F (1, 229) = 17.54, p < .0001. Scores on the Wechsler Abbreviated Scale of Intelligence were not associated with gastrointestinal symptoms, controlling for caregiving history and sex; GI Factor 1: β = .00, t (3) = −0.12, p = .902; GI Factor 2: β = .00, t (3) = 0.95, P = .342, or with anxiety measured at the Time 1 assessment, β = .00, t (3) = −1.95, p = .053. Modal household income per year for both caregiving groups was between $100,000 and $150,000, but was statistically higher in adopting families than in the comparison sample, F (1, 331) = 19.69, p < .0001 (though both were well above the national mean $38,321; US Census Data, for 1 or more child families in 2015). Income was not associated with gastrointestinal symptoms, Factor 1: β = −.02, t (4) = −0.91, p = .361, Factor 2: β = .00, t (4) = 0.14, p = .890, or anxiety at the baseline assessment, β = .01, t (4) = −1.87, p = .63 (controlling for age, sex, and caregiving group). Median parental education was a 4-year college degree in comparisons and a master’s degree in the EA group, which also differed across groups, F(1, 337) = 15.63, p < .0001. Differences in household education were also not associated with gastrointestinal or anxiety symptoms: gastrointestinal distress Factor 1: β = −.04, t (4) = − 1.14, p = .256; digestive issues Factor 2: β = .03, t (4) = −1.04, p = .298; anxiety at baseline assessment: β = .01, t (4) = 1.84, p = .070 (controlling for participant age, sex, and caregiving group).
The institutional review board at the University of California, Los Angeles, approved the protocol. Parents provided written consent, children 7+ years old provided written assent, and children under 7 provided verbal assent.
Child gastrointestinal symptoms (parent report)
To assess gastrointestinal symptomatology, we examined gastrointestinal distress items included within the CBCL for age 1.5–5 and 4–18 years (Achenbach, 1991) and the RCADS-P (Chorpita, Moffitt, & Gray, 2005). The CBCL uses a 3-point scale (0 = not true, 1 = somewhat true, 2 = very true). Only items asssessing gastrointestinal symptoms that were present in both CBCL 1.5–5 years and 4–18 years were included in the analysis, such that the same GI symptoms could be assessed across the entire age range. The CBCL items assessed incidence of nausea (Question 45 [1.5–5 years], or Question 56c [4+ years]: “child suffers nausea with no known medical cause”), stomach aches/cramps (Question 78 [1.5–5 years] or Question 56f [4+ years]: “child suffers stomach aches with no known medical cause”), expulsion (Question 93 [1.5–5 years] or Question 56g [4+ years]: “child suffers vomiting with no known medical cause”), and constipation (Question 12 [1.5–5 years] or Question 49 [4+ years]: “child suffers constipation with no known medical cause”). The RCADS-P uses a 4-point scale (0 = never, 1 = sometimes, 2 = often, 3 = always). The RCADS-P item assessed gastrointestinal somatic symptoms (Question 3: “When my child has a problem he/she gets a funny feeling in their stomach”). The five items from the CBCL and one item from the RCADS-P were subjected to a factor analysis to summarize their underlying covariation.
Child anxiety assessment (parent report)
Anxiety-related behavior was assessed through parent report on the Screen for Child Anxiety Related Disorders—Parent version (SCARED-P; Birmaher et al., 1997), which provides a continuous measure of anxiety. Because we were interested in anxiety behavior counts (not diagnoses) across this wide age range, we used the SCARED-P, which was originally validated for clinical cutoffs on a sample of children aged between 8 and 18 years. To rule out the possibility that including SCARED-P data from children younger than 8 years old altered the nature of the association between gastrointestinal symptoms and SCARED-P, our analyses included a confirmatory analysis in children aged 8 and over; the results of the two analyses did not differ. Parents reported on the frequency of each behavior for their child on a 3-point scale (0 = never, 1 = sometimes, 2 = often), and these responses were summed to create a behavior count and then averaged to create a mean score. One question on the SCARED-P (Item 11: “my child gets stomach aches at school”) was removed from the total summed subscale to avoid overlap with the gastrointestinal measure. Parents completed the measure at up to three time points, spaced approximately 2 years apart, providing a longitudinal assessment of child anxiety. Thus, anxiety could be assessed across a 5-year time frame.
Longitudinal attrition analysis
Of the N =130 participants with planned follow-up contrasts (i.e., a subset of the large parent grant study [N = 234] who were targeted for follow-up), 117 were actually followed-up (either one or two additional time points). Thus, of the 117 subjects for which no follow-up data was obtained, only N =13 subjects represent true attrition (i.e., they were intended for follow-up but did not return). To ensure that true attrition (i.e., within the youth intended for follow-up) was not being driven by systematic differences in anxiety at baseline between youth who returned for intended follow-up and those who did not return for intended follow-up, we performed an analysis of variance (ANOVA) with baseline anxiety as the dependent variable and attrition status (lost to follow-up vs. successfully followed) as the predictor (controlling for caregiving group, sex, and age at Time 1). Youth who were lost to follow-up did not differ in Time 1 anxiety scores from youth who were successfully followed, F (1, 181) = 1.22, p = .270. To ensure that there were no systematic differences in Time 1 anxiety between youth who were followed-up (regardless of whether they were intended to be followed) we performed another ANOVA with Time 1 anxiety as the dependent variable, and follow-up status (follow-up vs. no follow-up data) as the predictor (controlling for caregiving group, sex, and age at Time 1). Youth who provided follow-up data did not differ from youth who did not provide follow-up data on Time 1 anxiety levels, F (1, 271) = 0.52, p = .470. (see Figure 1 for a graphical depiction of the time line of Study 1 and Study 2).
Figure 1.
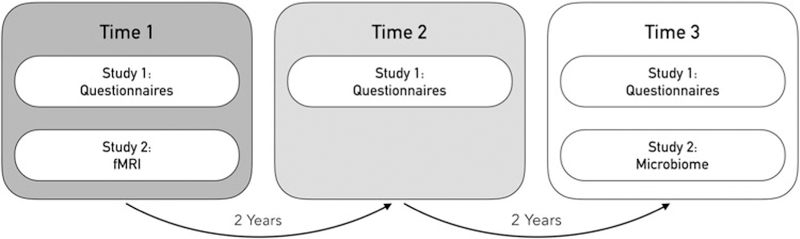
Study timeline for Study 1 (full sample) and Study 2 (microbiome–fMRI proof-of-concept subsample). Associations between gastrointestinal symptoms at Time 1 and anxiety symptoms at Times 1, 2, and 3 (Years 1, 3, and 5) of the study were made. In addition, associations between fMRI at Time 1 and microbiome composition at Time 3 are explored. Times 2 and 3 are presented on increasingly translucent backgrounds to highlight the decreasing number of participants who were intended for follow-up at each time point.
Statistical tests
All analyses were conducted in SPSS. All statistical tests were two-sided and the alpha value was set as a = 0.05. We used separate linear regressions to assess associations between gastrointestinal distress/digestive issues and anxiety measured at Visit 1. We then tested a cross-sectional mediation model using the PROCESS macro within SPSS (Hayes, 2012; Model 4) with care-giving group as the independent variable, anxiety at Visit 1 assessment on the SCARED-P as the outcome variable, and gastrointestinal symptoms as the mediator (controlling for participant age and sex at the level of the mediator and dependent variable). Bias corrected 95% confidence intervals (CI) using 5,000 bootstrapped samples are reported. Cross-sectional, rather than longitudinal, mediation was used as we had the highest number of participants at the baseline (i.e., Time 1) assessment, to address our claim of determining whether significant variance in the association between adversity and anxiety was explained by gastrointestinal symptoms. That is, we were not interested in the predictive nature of the mediation model.
To assess prospective associations between gastrointestinal distress and anxiety across time, we performed a linear mixed model in SPSS with maximum likelihood estimation to accommodate the nested structure of the data (individual change in anxiety from Time 1 to Time 3). This method captures individual variance while allowing for missing data points, thus dealing with attrition (note: as explained above, due to study design, the fewer data points available at Time 2 and Time 3 than at Time 1 was expected, and there were no systematic differences in anxiety between followed and non-followed participants). Caregiving condition (comparison vs. early adversity), time (baseline, Time 2, and Time 3), and gastrointestinal distress scores were entered as fixed effects predictors of SCARED-P anxiety scores, with random slope and intercept between individuals. Age and sex (male vs. female) were entered as covariates in the model.
Results
Factor analysis of gastrointestinal symptoms
Principal components factor analysis was used to identify and compute composite scores for factors underlying the items that were assessing gastrointestinal distress extracted from the CBCL and RCADS-P (nausea, stomach ache/cramp, funny feeling in stomach, vomiting, and constipation). Four of the five items examined correlated at least .3 with at least one other item, indicating that factor analysis was a reasonable approach to condense these data. Moreover, the Kaiser-Meyer-Olkin measure of sampling adequacy was .66, which is above the recommended cutoff value of .6, and Bartlett’s test of sphericity was also significant, χ2 (10) = 130.84, p < .0001. The diagonals in the anti-image correlation matrix were all over .5, and the extracted communalities were all over .3 also suggesting shared variance among the items that could be reasonably condensed through factor analysis.
Initial eigenvalues indicated that two factors explained 36.07% and 20.33% of the variance, respectively, whereas Factors 3–5 had eigenvalues <1 and explained 17.10%, 14.58%, and 11.92% of the variance, respectively. The two-factor solution was examined using varimax rotation of the factor-loading matrix and was found to be a good fit to the data with all primary loadings exceeding .5, and no cross-loading exceeding .4 (factor loading matrix is presented in Table 2). The first factor was labeled “gastrointestinal distress” (GI distress) due to its being composed of items measuring nausea, somatic complaints, and stomach aches and cramps. The second factor was labeled “digestive issues” due to its being composed of items that reflected digestive issues: vomiting and constipation.
Table 2.
Factor loadings on the varimax rotated component matrix for gastrointestinal symptoms assessed on the Child Behavior Checklist (CBCL) and the Revised Children’s Anxiety and Depression Scale (RCADS) in N = 344 youth
| Items | Scale | Factor loadings for Factor 1, gastrointestinal distress |
Factor loadings for Factor 2, digestive distress |
|---|---|---|---|
| “When my child has a problem he/she gets a funny feeling in their stomach” | CBCL | .805 | −.140 |
| “Child suffers nausea with no known medical cause” | CBCL | .746 | .274 |
| “Child suffers stomach aches with no known medical cause” | CBCL | .716 | .181 |
| “Child suffers vomiting with no known medical cause” | CBCL | .276 | .653 |
| “Child suffers constipation with no known medical cause” | RCADS | −.062 | .818 |
Note: The two-factor solution of “gastrointestinal distress” and “digestive issues” was the best fit of the data.
Association of caregiving history with gastrointestinal distress and digestive issues
Composite scores on the two factors were entered as outcome variables in separate linear regressions with caregiving group as the independent variable of interest (COMP vs. EA), covarying for the effects of sex and age. EA exposure was significantly associated with higher GI distress scores (i.e., Factor 1), β = .25, t (340) = 2.20, p = .028, 95% CI [0.03, 0.47] (Figure 2a), as was increasing child age, β = .04, t (340) = 3.22, p = .001, 95% CI [0.02, 0.07] (online-only Supplemental Figure S.1), but sex and GI distress were not associated, β = .17, t (340) = 1.59, p = .113, 95% CI [−0.04, 0.38]. EA exposure, was also associated with higher scores on the digestive issues factor (i.e., Factor 2), β = .41, t (340) = 3.57, p = .0004, 95% CI [0.18, 0.63] (Figure 2b), but age and sex were not, age: β = .00, t (340) = −0.07, p = .943, 95% CI [−0.02, 0.03], sex: β = .11 t (340) =0.98, p = .330, 95% CI [−0.11, 0.32]. Within the EA group, using child sex and age as covariates, age of adoption was not associated with GI Distress, β = .00 t (109) =0.95, p = .342, 95% CI [−0.01, 0.01], or with digestive issues, β = .00, t (109) = −0.55, p = .582, 95% CI [−0.01, 0.01]. See Supplemental Figure S.1 for the association between caregiving history and GI distress broken down by child age range: preschool, middle childhood, and adolescence.
Figure 2.
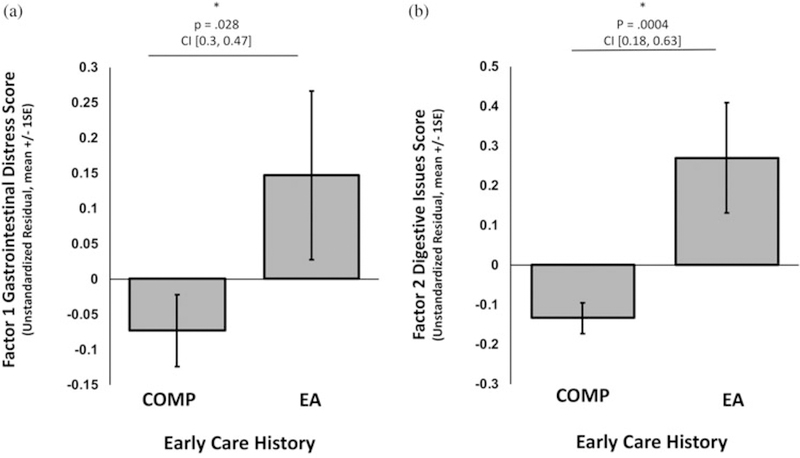
Association of caregiving history group membership (early adversity exposed [EA] or comparison [COMP] group) with (a) Factor 1, gastrointestinal distress, and (b) Factor 2, digestive issues. Bars represent the group averages. An * denotes a statistically significant result. P values and 95% confidence intervals (CI) of the beta estimate from the regression analysis are reported above each graph.
Association of GI distress and digestive issues with youth anxiety
Separate linear regressions were used to test the association of scores on each factor (GI distress or digestive issues) with anxiety (measured with the SCARED-P), controlling for caregiving group, age, and sex.
Factor 1: GI distress.
GI distress was significantly associated with Time 1 anxiety scores on the SCARED-P, β = .08, t (325) = 6.04, p < .0001, 95% CI [0.06, 0.11] (Figure 3a), as was sex, β = .07, t (325) = 2.78, p = .006, 95% CI [0.02, 0.13], and caregiving group, β = .18, t (325) =6.25, p < .0001, 95% CI [0.12, 0.23], but not age, β= .00, t (325) = 0.67, p =.506, 95% CI [−0.01, 0.01]. The association of GI distress and anxiety was confirmed when including only children over 8 years of age (N = 168); β = .09, t (164) =4.91, p < .0001, 95% CI [0.05, 0.12].
Figure 3.
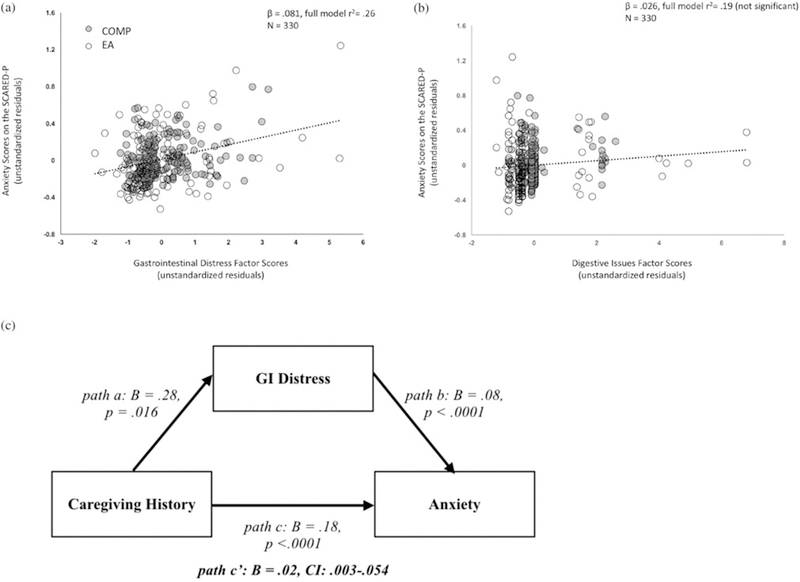
Scatter plots illustrating the association between mean parent-rated child anxiety scores on the Screen for Child Anxiety Related Disorders—Parent version (SCARED-P) at Visit 1 with (a) Factor 1, gastrointestinal (GI) distress, and (b) Factor 2, digestive issues. Dots are colored by caregiving group membership, where children who had experienced early adversity (EA) are represented in open circles, and children from the comparison group (COMP) are presented in gray transparent circles (transparency is utilized so that overlapping values can be viewed). (c) The cross-sectional mediation model where children who were exposed to early adversity (coded positively) exhibit elevated anxiety through a pathway of increased GI distress.
Factor 2: Digestive issues.
Digestive issues were not significantly associated with variance in SCARED-P anxiety scores, β = .03, t (325) = 1.83, p = .068, 95% CI [0.00, 0.05] (Figure 3b), though digestive Issues were generally low incidence overall. Similarly, age was not associated with SCARED-P anxiety scores, β = .01, t (325) = 1.76, p = .080, 95% CI [0.00, 0.01], but sex, β = .09, t (325) = 3.10, p = .002, 95% CI [0.03, 0.14], and caregiving group, β = .19, t (325) =6.35, p < .0001, 95% CI [0.13, 0.25] were. As with Factor 1, the nonsignificant association between digestive issues and anxiety was confirmed when including only children over 8 years of age (N = 168); β = .02, t (164) = 1.16, p = .250, 95% CI [−0.02, 0.06].
Elevated GI distress explains variance in the association between early adversity and concurrent anxiety
To determine whether GI distress was a mediator of the relationship between caregiving history and anxiety, we tested a full cross-sectional mediation model with caregiving group as the independent variable, Time 1 anxiety scores on the SCARED-P as the dependent measure, scores on the GI distress factor at Time 1 as the mediator, controlling for participant age and sex. Cross-sectional mediation was performed as Time 1 had the highest number of data points, and to explain variance in, rather than “predict,” the anxiety outcome. The mediation was significant; the path between caregiving group and scores on the GI Distress measure (path a) was significant, β = .28, SE = .12, t (326) = 2.42, p = .016, 95% CI [0.05, 0.51], as were the paths between GI distress and anxiety (path b), β = .08, SE = .01, t (325) = 6.04, p < .0001, 95% CI [0.05, 0.11], and between EA caregiving history and anxiety (path c’), β = .18, SE = .03, t (325) = 6.25, p < .0001, 95% CI [0.12, 0.23]. The bootstrapped confidence interval for the mediation effect (pathway a*b; i.e., the indirect association of EA group with increased anxiety via elevated GI distress), did not contain zero; β = .02, SE = .01, bootstrapped CI [0.003, 0.05] (Figure 3c).
Association of anxiety change across time with GI distress
To assess whether GI distress was associated with change in anxiety scores across time, we performed a linear mixed-model regression. There were significant main effects of GI distress, F (29, 275.27) = 4.14, p < .0001, ηp2 = .32, caregiving group, F (1, 353.40) = 24.50, p < .0001, ηp2 = .06, sex, F (1, 308.34) = 7.26, p = .007, ηp2 = .02, and time, F (2, 111.63) = 14.66, p < .0001, ηp2 = .21, such that individuals with higher GI distress at Time 1, those from the EA group, and females, had higher anxiety symptoms, and anxiety symptoms decreased across time. There was also a significant GI Distress × Time interaction, F (31, 113.00) = 5.80, p < .0001, ηp2 = .61, and a Caregiving Group × GI Distress interaction, F (8, 313.60) = 3.39, p = .001, ηp2 = .19 (Figure 4a). There was no main effect of age at Time 1, F (1, 330.28) = 0.05, p = .829, ηp2 < .0001, nor were the interactions between Caregiving Group × Time, F (2,104.89) = 2.99, p = .054, ηp2 = .05, and GI Distress × Caregiving Group × Time, F(6, 129.15) = 1.47, p = .193, ηp2 = .01, significant (but see Figure 4b for associations broken down by caregiving condition). Post hoc linear regressions of the association between anxiety and GI distress (controlling for age, sex, and caregiving group) revealed a positive association between GI distress and anxiety at baseline (i.e., Time 1), β = .08, t (325) = 6.04, p < .0001, CI [0.06, 0.11], and Time 2, β = .05, t (109) = 2.57, p = .012, CI [0.01, 0.09], but by Time 3 there was no longer an association between anxiety and GI distress, β = .00, t (55) =0.114, p = .909, CI [−0.04, 0.05], such that GI distress in early life was associated with heightened anxiety symptoms concurrently and when measured 2 years later. See the online-only supplemental data for a confirmatory analysis using a repeated-measures ANOVA with listwise deletion, which shows that imputed data were not driving the results reported here.
Figure 4.
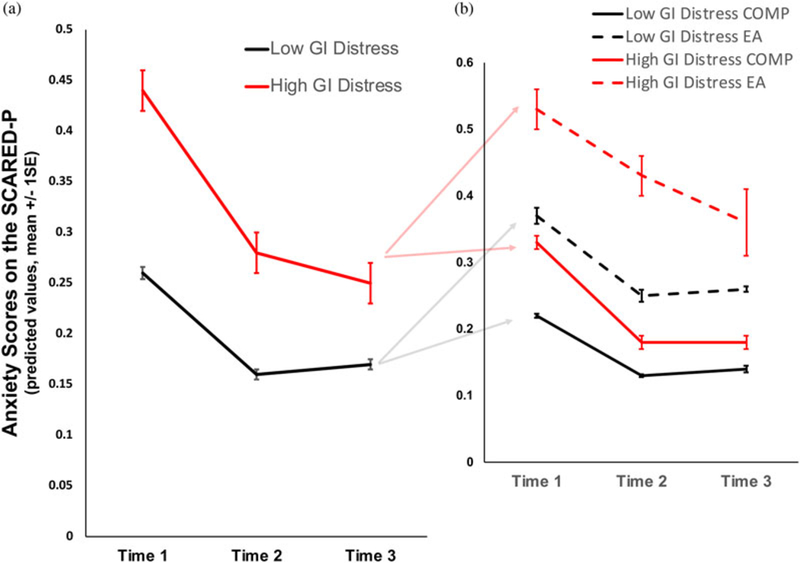
(a) Association between Factor 1, gastrointestinal (GI) distress scores (median split into high GI distress and low GI distress scores), and predicted values of parent-rated child anxiety on the Screen for Child Anxiety Related Disorders—Parent version (SCARED-P) at Visits 1, 2, and 3. (b) The same association broken down by caregiving group with children from the comparison (COMP) group represented in the solid lines, and children in the early adversity (EA) exposed group in dotted lines, with low GI distress in black and high GI distress in red.
To ensure that the association of gastrointestinal symptoms at Time 1 with anxiety symptom change across Time (Time 1-Time 2) was not confounded by continued gastrointestinal symptoms, we tested another model that covaried for gastrointestinal symptoms at later time points (Time 2 and 3). Because the same factor structure may not emerge at all time points, we instead created a standardized sum score of the items from the Factor 1 structure that emerged at Time 1 (baseline) and used those as covariates at Time 2 and Time 3. Due to the study design, which resulted in a smaller sample size at Time 2 and Time 3 than at Time 1, entering covariates for Time 2 and Time 3 substantially reduced the sample size (N = 62). Nonetheless, the same basic associations persisted. There was a significant effect of time, F (2, 67.73) = 14.67, p < .0001, ηp2 = .30, baseline GI distress, F (13, 69.46) = 3.24, p = .001, ηp2 = .38, and GI distress at Time 2, F (1, 57.92) = 13.26, p = .001, ηp2 = .19, such that anxiety symptoms decreased across time in everyone, but remained higher in individuals with elevated GI distress at baseline and Time 2. Most important, the significant Time × Baseline GI Distress interaction reported above was also seen in these models, F (26, 67.82) = 5.29, p < .0001, ηp2 = .67. There were no main effects of caregiving group, F (1, 69.68) = 0.55, p = .462, ηp2 = .007, sex, F (1, 58.21) = 1.47, p = .230, ηp2 = .02, and age, F (1, 58.39) = 1.00, p = .321, ηp2 = .02, nor were the interactions Caregiving Group × Baseline GI Distress, F (2, 69.13) =1.00, p = .370, ηp2 = .03, Caregiving Group × Time, F (2, 67.97) = 2.50, p = .090, ηp2 = .07, or the three-way interaction Caregiving Group × Time × Baseline GI Distress, F (4, 68.35) = 2.12, p = .088, ηp2 = .11, significant.
Study 2: Microbiome-Brain “Proof-of-Concept” Associations
Method
Participants
We tested a “proof-of-concept” association between early caregiving adversity, the gastrointestinal (GI) microbiome, and brain reactivity to threat stimuli (fear faces) in a smaller “convenience sample” that was a subset of the Study 1 population (N =16; mean age = 8 years, range = 5–11 years). The children used in Study 2 were selected if they had provided usable task-based magnetic resonance imaging (MRI) data in childhood (ages 5–11 years), and agreed to donate a stool sample. This age range was chosen as we have previously documented it as a sensitive period for prefrontal cortex development in youth (Gee, Humphreys, et al., 2013). The functional MRI (fMRI) data from this subsample has been published previously to address a different question of interest (i.e., not related to the microbiome; Gee, Gabard-Durnam, et al., 2013; Gee, Humphreys, et al., 2013). As this was a convenience sample, the microbiome data were collected after children had come in for their MRI scan (average 3.95 years, SD = 0.55 years, after scanning/anxiety assessments). The GI microbiome was analyzed through taxonomic identification of bacteria in stool samples using 16S rRNA as a marker gene for bacterial identification. No exclusions were made for any of the analyses. Adversity-exposed children in Study 2 were all exposed to prior institutionalization (i.e., no child experienced foster care). Sample demographics (split into Study 1 and 2) are presented in Table 1.
Child diet assessment (parent report)
Parents completed a daily diary of their children’s food intake in the 2 days preceding stool sample collection. Using online nutrition programs, the food diary was coded into amount of protein, carbohydrate, and fat (which can influence bacterial composition) for each meal and was averaged across 2 days. These variables were then included as covariates in offline analyses of potential confounding factors. In addition, parents answered questions that assessed the presence and frequency of children’s gastrointestinal symptoms/pain (e.g., diarrhea, bloating, and pain in the upper or lower abdomen). Frequency of gastrointestinal symptoms was coded on a 4-point scale corresponding to the judgments never, infrequent, frequent, and always. Frequency of pain was coded on a 5-point scale corresponding to the judgments never, 1–3 times per month, once per week, several times a week, and every day. No children were on antibiotic or antifungal medication, and only 1 child had a strictly vegetarian diet. As these data are only available in N =16 subjects from Study 2, results of this gastrointestinal symptom questionnaire are presented in Table 3, but were not included in the factor analysis in Study 1.
Table 3.
Mean (SD) responses for individual questions on the parent proxy-reported gastrointestinal symptoms questionnaire stratified by caregiving history in the subsample (Study 2) only
| Diet questionnaire item: “How often does your child experience …” |
COMP Mean rating for symptom frequency (SD) |
EA Mean rating for symptom frequency (SD) |
P value |
Cohen’s d |
|---|---|---|---|---|
|
| ||||
| Complaints of a stomach ache | 0.43 (0.53) | 0.57 (0.53) | .626 | 0.27 |
|
| ||||
| Diarrhea | 0.43 (0.53) | 1.29 (0.76) | .031 | 1.31 |
|
| ||||
| Constipation without compensatory diarrhea | 0 (0) | 0.57 (0.79) | .103 | 1.03 |
|
| ||||
| Constipation with compensatory diarrhea | 0.14 (0.38) | 0.57 (0.79) | .228 | 0.69 |
|
| ||||
| Distension in the abdomen (bloating) | 0.29 (0.49) | 0 (0) | .172 | 0.83 |
|
| ||||
| Abdominal discomfort | 0.57 (0.53) | 0.86 (0.69) | .403 | 0.46 |
|
| ||||
| Pain above the belly button | 0 (0) | 0.57 (1.13) | .231 | 0.71 |
|
| ||||
| Pain below the belly button | 0.57 (0.53) | 0.71 (1.11) | .765 | 0.16 |
|
| ||||
Note: For both groups n =7. T tests were used to assess group differences between children from the comparison (COMP) and early adversity (EA) exposed groups.
Stool sample collection
Parents were asked to help their child collect a small stool sample. Parents were given an OMNIgene.GUT (DNA Genotek) home collection kit, which included a spatula, collection tube with stabilizing liquid (ethyl alcohol <24%), and instructions on how to collect, homogenize, and store the sample. This method of sample stabilization has been shown to successfully preserve bacteria concentrations in stool for up to 8 weeks at room temperature (Song et al., 2016). Each child provided one sample, collected at home, and then sent directly to the sequencing lab: Research and Testing Laboratory (RTL Genomics, Texas).
16s rRNA sequencing and preprocessing
Bacterial DNA was extracted from stool samples provided by 16 children using RNA Power Soil kits (Mo Bio Laboratories). Illumina MiSeq, paired-end sequencing across 250 base pairs was used. Samples were amplified for sequencing in a two-step process using primers spanning the V1-V2 hypervariable region of the 16S rRNA gene. The forward primer was constructed with (5’−3’), the Illumina i5 sequencing primer (TCGTCGGCA GCGTCAGATGTGTATAAGAGACAG), and the 28F primer (GAGTTTGATCNTGGCTCAG). The reverse primer was constructed with (5’−3’), the Illumina i7 sequencing primer (GTCTCGTGGGCTCGGAGATGTGTATAAGAGACAG), and the 388R primer (TGCTGCCTCCCGTAGGAGT). Amplifications were performed in 25 μl reactions with Qiagen HotStar Taq master mix (Qiagen Inc, Valencia, California), 1 μl of 5uM primer, and 1pl of template. Reactions were performed on ABI Veriti thermocyclers (Applied Biosytems, Carlsbad, California) under the following thermal profile: 95 °C for 5 min, then 25 cycles of 94 °C for 30 s, 54 °C for 40 s, 72 °C for 1 min, followed by one cycle of 72 °C for 10 min and 4 °C hold. Products from the first stage amplification were added to a second polymerase chain reaction (PCR) based on qualitatively determined concentrations. Primers for the second PCR were designed based on the Illumina Nextera PCR primers as follows: Forward, AATGATACGGCGACCACCGAGATCTACAC [i5index]TCGTCGGCAGCGTC, and Reverse, CAAGCAGAAGA CGGCATACGAGAT[i7index] GTCTCGTGGGCTCGG. The second stage amplification was run the same as the first stage except for 10 cycles. Amplification products were visualized with eGels (Life Technologies, Grand Island, New York). Products were then pooled equimolar, and each pool was size selected in two rounds using Agencourt AMPure XP (BeckmanCoulter, Indianapolis, Indiana) in a 0.7 ratio for both rounds. Size selected pools were then quantified using the Quibit 2.0 fluorometer (Life Technologies) and loaded on an Illumina MiSeq (Illumina, Inc. San Diego, California) 2 × 300 flow cell at 10 pM.
Illumina reads were quality controlled by removal of short sequences, singleton sequences, and noisy reads. Denoising was performed on each region by trimming back to the last base where the total average of the sequence was greater than 25. Prefix dereplication was then performed using the USEARCH algorithm (Edgar, 2010), clustering at the 4% divergence level. Selection of operational taxonomic units (OTUs) was performed using the UPARSE OTU selection algorithm (Edgar, 2013). OTU selection was performed de novo, and OTU sequences were then classified against an in-house database of high-quality sequences derived from the National Center for Biotechnology Information and maintained at Research & Testing Laboratory Genomics. Chimera detection was then performed on the selected OTUs using the UCHIME chimera detection software executed in de novo mode (Edgar, Haas, Clemente, Quince, & Knight, 2011), and chimeric sequences removed. The remaining sequences were then corrected base by base to aid in the removal of noise. Denoised and chimera checked reads were then condensed into FASTA formatted files for taxonomic identification and community analyses. To assign taxonomic information the sequences were run through the USEARCH global alignment program. All preprocessing steps were performed blind to the care-giving history and characteristics of the children.
Microbial richness and diversity analyses
Figure 5 provides a description of different metrics for measuring community composition of the microbiome that are used in this paper. We visualized genera-level taxonomic community composition through the VAMPS (Visualization and Analysis of Microbial Population Structure) community visualization tool (Huse et al., 2014). Ribosomal Database Project (RDP) taxonomy was assigned, and within-subject differences in the number of bacterial groups (in this case, genus) present in the sample (i.e., alpha diversity) were calculated using two estimators: observed richness (which provides a count of the number of different genera represented in the sequenced sample), and Shannon’s index (which provides a metric of how rich and evenly distributed the groups are). Statistical differences in alpha diversity between the groups were analyzed using separate linear regressions (controlling for age and sex). Variances between the caregiving groups were similar. Between-subject differences in bacteria present in the sample (i.e., beta diversity) was quantified using an approach that takes into account the phylogenetic relations between genera, Unifrac distance, calculated within the phyloseq package in R (McMurdie & Holmes, 2013). Paired samples that contain bacteria that are closely related on the phylogenetic tree (i.e., share many tree branches) score low on beta diversity, whereas paired samples that are not related (or are distantly related) on the phylogenetic tree will receive high beta diversity scores, resulting in a distance matrix of between-samples beta diversity scores for every sample pair in the study. A nonparametric permutational multivariate analysis of variance was used to compute an R2 and significance value for the amount of variance in the distance matrices that was explained by the grouping variable of interest (caregiving group: COMP or EA). Two of such analyses were conducted: weighted (which weights the dominant bacteria) and unweighted (which allows the rare bacteria to be influential in the beta diversity score).
Figure 5.
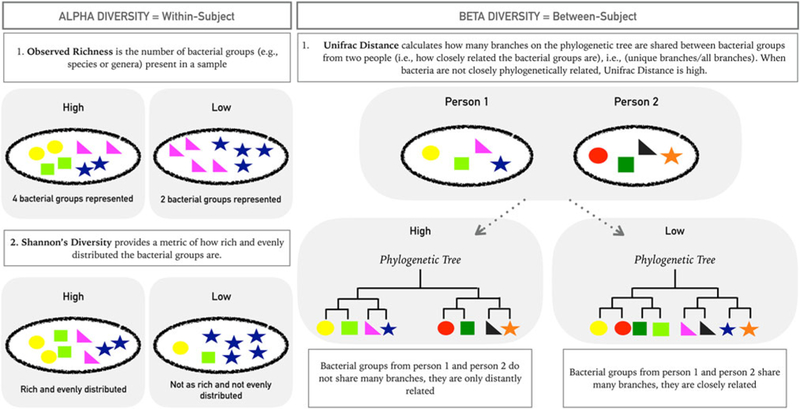
Explanatory figure of microbial community assessment metrics for alpha and beta diversity. The within-subject metric of alpha diversity called “observed richness” quantifies the total count of bacterial groups at a given taxonomic level (e.g., species, genera, or phyla) in a sample from an individual person in the study. Higher counts of bacterial groups present in the sample indicate higher observed richness. Note that only the bacterial groups, not the numbers of members within each bacterial group, are quantified. The second within-subject metric of alpha diversity measured in this study is Shannon’s diversity, which provides a measure of how rich and evenly distributed the bacterial groups are. Samples scoring highest on Shannon’s diversity will have a high number of bacterial groups represented (richness), and the members of each bacterial group will be approximately equal (i.e., evenly distributed). Samples with very low counts of bacterial groups (richness) and where a small subset of bacterial groups dominates the community (uneven distribution of members) will result in the lowest Shannon’s diversity score. The between-subject metric of beta diversity measured in this study was Unifrac distance. This metric calculates the relative closeness of bacterial groups found in paired samples from people on a phylogenetic tree. Samples that are closely related on the tree will share many branches and will receive a low Unifrac distance score (unshared/all branches). Samples from two individuals where the bacterial groups are far away from each other on the phylogenetic tree will share few branches and will receive a high Unifrac distance score. A distance matrix between each pair of samples in the study is constructed.
Bacterial biomarker analysis
Differences in specific bacteria between caregiving groups were identified with a linear discriminant analysis of effect sizes (LEfSE) performed through the Galaxy platform (Segata et al., 2011). In short, LEfSE uses the nonparametric sum rank Kruskal-Wallis test to detect bacteria that differ between the classes of interest (in this case, care history), followed by linear discriminant analysis (Fisher, 1936) to detect the effect size of each of these differences. Due to the relatively small sample size, we carefully checked the resulting potential biomarkers for outlying values (>3 SD from the mean) and excluded any “biomarker” that had at least one value exceeding the threshold.
MRI task paradigm
During the fMRI scan, participants completed two runs of an emotional faces task. The task consisted of a mixed design with one blocked variable (emotional valence: fear and happy) and one event-related variable (emotion and neutral). During each run, participants viewed faces presented one at a time that were either emotional or neutral. The order of runs (i.e., happy/neutral, fear/neutral) was counterbalanced across participants, and the stimulus order within each run was randomized and fixed. To ensure that participants were paying attention, they were instructed to press a button with their index finger when they saw a neutral face. The faces were selected from the Karolinska Directed Emotional Faces database (Lundqvist, Flykt, & Ohman, 1998). The faces were presented in color at a visual angle of approximately 15 degrees. The probability of an emotional face was 50% on any given trial. Stimuli were jittered (variable intertrial interval ranging from 3000 to 9000 ms) and randomized based on a genetic algorithm in order to allow for unique estimates of the hemodynamic response for each trial type. Each run contained 48 trials (24 neutral faces, 24 fearful or happy faces). Each face remained on the screen for 500 ms. Because fear faces have been shown to activate prefrontal cortex circuits in developing youth (Gee, Gabard-Durnam, et al., 2013; Gee, Humphreys, et al., 2013), and are known to engage threat circuitry relevant to anxiety (Baird et al., 1999), analyses focused on fear faces (i.e., we examined blood oxygen level dependent responses to fear faces, relative to implicit baseline). As participants were instructed to press a button when they saw a neutral face, effectively rendering the neutral face salient, we decided not to examine blood oxygen level dependent responses to neutral faces. Rather than trying to isolate any one neural process in our examination of the fear versus implicit baseline contrast, we are using fear faces as a probe of affective circuitry function.
fMRI data acquisition
Scanning was performed in a Siemens Trio 3.0 tesla MRI scanner. A standard radiofrequency 12-channel head coil was used. A whole-brain high resolution T1 weighted anatomical scan (MPRAGE; 256 × 256 in-plane resolution; 256 mm field of view; 192 × 1 mm sagittal slices) was acquired for each participant in order to register and localize their functional data to standard space. The emotional faces task was presented on a computer screen within MR-compatible goggles. T2* weighted echoplanar images (interleaved) were collected at an oblique angle of ~30 degrees (130 volumes/run; resonance time 2000 ms; echo time, 30 ms; flip angle, 90 degrees; matrix size, 64 × 64; field of view, 192 mm; 34 slices; 4-mm slice thickness; skip 0 mm; 24 observations per event type).
fMRI data analysis
Preprocessing.
Each participant’s fMRI scan data was motion corrected using the Analysis of Functional Neuroimages (AFNI; Arumugam et al., 2011) 3dvolreg; the first volume was the reference image. Images were then slice time corrected in AFNI, and aligned to each subjects MPRAGE image using FLIRT in FMRIB Software Library (FSL; Jenkinson, Beckmann, Behrens, Woolrich, & Smith, 2012), before being scaled to the mean of each voxel. MPRAGE structural images were skull stripped in FSL using BET, and FAST was used to segment gray matter, white matter, and ventricles (cerebrospinal fluid; CSF). These anatomical parcellations were then used to extract signals from the white matter and CSF in the fMRI scan. MPRAGE scans were warped to standard template space from the Montreal Neurological Institute (Montreal, Canada) using a nonlinear registration procedure (FLIRT and FNIRT) with boundary-based registration cost algorithm in FSL, and resulting warp transformation saved for application to the functional data. Preprocessed functional data were spatially aligned and normalized to each participant’s warped MPRAGE using the nonlinear registration (FNIRT). Functional data were spatially smoothed with a 6-mm full width at half max kernel. Montreal Neurological Institute transformed images had a resampled resolution of 3 mm3. Time series were normalized to percent signal change to allow for comparison across individuals and runs. The functional runs were concatenated before creating two individual-level models for each participant to model functional reactivity and connectivity.
Motion correction.
Systematic procedures were implemented to reduce motion due to the age of the children. Children participated in a mock scanning session in the lab before the actual MRI. This mock session allowed children to become acclimated to the scanning environment, noises, and procedures, to get real-time feedback on their ability to lie still, and to practice that skill. During data collection, an air vacuum pillow (Siemens Comfort Pack) was used to pad and secure the child’s head in a comfortable, steady position. Additional padding was placed around the child’s head as required. Children also received reminders to reduce motion and feedback on their level of motion throughout the scanning session.
After the scanning session, multiple steps were taken to correct for motion. Following recommended standards (Power, Barnes, Snyder, Schlaggar, & Petersen, 2012) all analyzed data were free of motion >0.9 mm in any direction. Volumes where the motion derivatives had a Euclidean norm >0.9 mm were excluded through censoring that volume and the subsequent volume. All participants had <40% of the total volumes censored (mean percentage of censored volumes, 8.12%, mode, 0%). Demeaned motion in each of six directions, and their temporal derivatives, were also included as regressors in the trial level regression (12 motion regressors total). At the group-level analysis, each subject’s average motion (mean displacement derivative) was also entered as a regressor. We also verified that our clusters of bacteria-related reactivity did not overlap with clusters that were related to average motion in the whole brain maps.
Whole-brain reactivity.
To examine whether the microbiome was associated with reactivity to fear faces, a whole-brain reactivity analysis was performed. A Generalized linear model analysis was performed in AFNI for each participant with regressors for task, CSF signal, white matter signal, 6 motion regressors, plus their 6 backward-temporal derivatives. The four task regressors modeled which face comprised each trial (i.e., fearful, happy, neutral faces [in the fearful run], and neutral faces [in the happy run]). Analyses focused on the contrast of fearful faces against implicit baseline (fixation). The generalized linear model analyses fit the percentage of signal change in the brain to each regressor, and linear and quadratic trends were modeled for the time series of each voxel to control for correlated drift.
Following individual-level analyses, the regression coefficients were then subjected to random-effects, group level analysis using the 3dttest command in AFNI. Two group-level analyses were run with participant level of bacterial genera (Bacteroides or Lachnospiraceae) entered as the regressor of interest in each, whereas participant caregiving condition, age at scan, time interval between scan and stool sample, and average motion displacement were entered as regressors of no interest in each. Monte Carlo simulations were conducted in AFNI’s 3dClustSim program, taking into account the average smoothness of the data set, with voxel thresholds of p = .01 and α = 0.05. Output cluster sizes were used to correct for multiple comparisons (k > 721 voxels). Based on the animal literature, which has highlighted the amygdala, hippocampus, and prefrontal cortex as central nodes involved in microbiome brain interactions across development (Hoban et al., 2016, 2017, 2018; Ogbonnaya et al., 2015), and the human literature implicating those same brain regions in anxiety and threat responsivity (reviewed in Callaghan & Tottenham, 2015), we identified bilateral amygdala, hippocampus, and medial prefrontal cortex a priori as regions of interest. We decided to perform a restricted search within those three brain regions if no microbiome associations with reactivity were observed when cluster correction occurred at the whole-brain level (this restricted search was used when examining associations with Bacteroides only). Using the Harvard Oxford Cortical and subcortical atlas in FSL, we made masks of the frontal medial cortex (20% threshold), bilateral amygdala (50% threshold), and bilateral hippocampus (50% threshold). We then binarized and combined the three masks to set a threshold for multiple comparison correction within the restricted search regions (5735 voxels in combined mask; p < .01, α = 0.05, k > 100 voxels). Across whole-brain and restricted searches, a relatively lenient voxel threshold of p < .01 (rather than p < .001) was chosen in this small proof-of-concept sample as the primary aim was to demonstrate feasibility of the approach and drive future hypotheses.
Statistical tests
We assessed group differences in the community composition of microbes (i.e., alpha diversity) through ANOVA with the bacterial community measure (e.g., Shannon’s diversity) as the outcome and caregiving history as the factor of interest, controlling for age at the time of stool sample, sex, and gastrointestinal distress and digestive issues factor scores.
Group differences in the community composition of bacteria between COMP and EA youth
Across all samples, bacteria from the genus Bacteroides were the most abundantly expressed, and the level of Bacteroides did not differ between groups of individuals with different early caregiving histories (controlling for age, sex, and gastrointestinal symptom factor scores), F (1, 10) = 1.49, p = .251, ηp2 = .13 (Figure 6a shows the relative abundance of the top 30 genera split by caregiving group). When considering the community structure of the microbiome, individuals that were EA had lower counts of bacteria: alpha diversity, observed richness, F (1, 10) = 7.18, p = .023, ηp2 = .42, but did not differ in the relative abundance of those bacteria: alpha diversity, Shannon index, F (1, 10) = 2.37, p = .155, ηp2 = .02. Group differences also emerged when comparing beta diversity. When rare bacteria were allowed to be influential (unweighted Unifrac distances), caregiving group significantly accounted for variation in bacterial distance matrices between individuals, adonis test, F (1, 14) = 1.72, p = .034, r2 = .11, ηp2 = .11 (see Figure 6b for the unweighted phylogenetic tree), but that association was reduced to trend level when dominant bacteria were weighted: weighted Unifrac distances, adonis test, F (1, 14) = 2.80, p = .060, ηp2 = .17.
Figure 6.
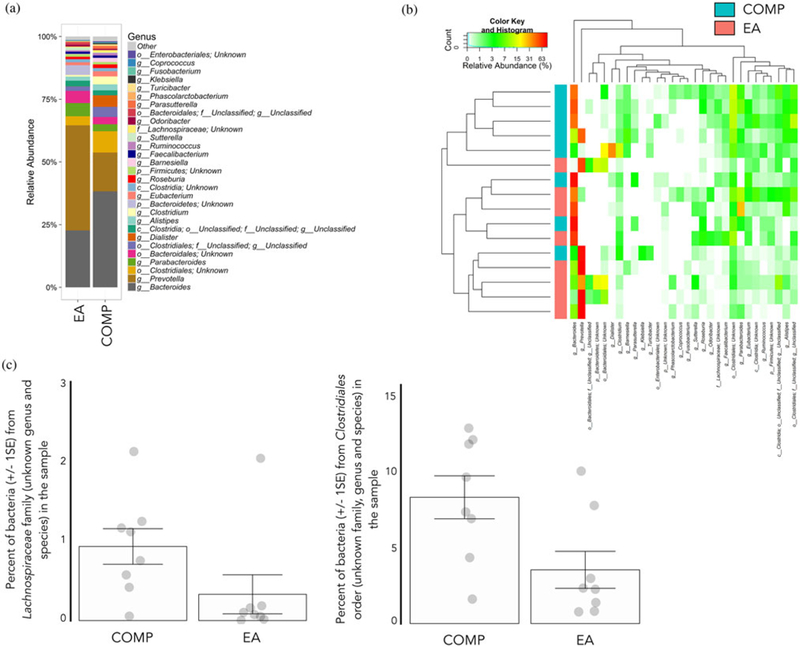
(a) Relative abundance of the 30 most dominant bacterial genera in early adversity (EA, n = 8) exposed and comparison (COMP, n = 8) children. (b) Heatmap of phylogenetic relatedness of samples based on unweighted Unifrac distances. The y-axis represents group membership with EA youth in pink and COMP youth in blue (i.e., each row represents an individual subject in the analysis), sorted by unweighted Unifrac distance. The bottom x-axis represents the individual bacterial groups (genera), and the top x-axis illustrates their sorting by Euclidean distance. The colors in the map represent the relative abundance of each bacterial group with warmer colors indicating higher relative abundance. (c) Caregiving group means of bacteria from order Clostridiales family Lachnospiraceae genus unknown and order Clostridiales family unknown genus unknown (bar) with individual subject values overlaid in gray transparent circles (transparency and random jittering of dots along the x-axis is used so that overlapping values can be viewed).
The LEfSE analysis indicated 10 bacterial genera as potential biomarkers for caregiving group membership, 8 of which were affected by outlying values for a single subject (>3 SD from the mean value) and were excluded from further analyses. The two biomarkers that were not affected by outlying values were from the order Clostridiales one of which was an unknown genus in the family Lachnospiraceae, and the other of which was an unknown genus and family. Both of these biomarkers were higher in children from the COMP than EA groups (see Figure 6c).
Brain-bacteria associations: General approach using genus Bacteroides
To establish associations between gastrointestinal bacteria and functional reactivity within brain networks implicated in anxiety, a whole-brain analysis was conducted on data from a task in which participants were looking at fear faces (relative to an implicit baseline). Individual subject Bacteroides levels were used as the regressor of interest (controlling for participant care-giving group, age at scan, the interval between scan and stool sample, and participant average motion after volume censoring). When correcting at the whole-brain level, Bacteroides was not associated with any reactivity clusters. Hence, we performed the restricted search within the bilateral amygdala and hippocampus, and frontal medial cortex, performing cluster correction within these regions only (resulting in a more liberal threshold). This approach revealed a small cluster of Bacteroides-associated reactivity in the medial prefrontal cortex ( p < .01, restricted search correction; Figure 7a).
Figure 7.
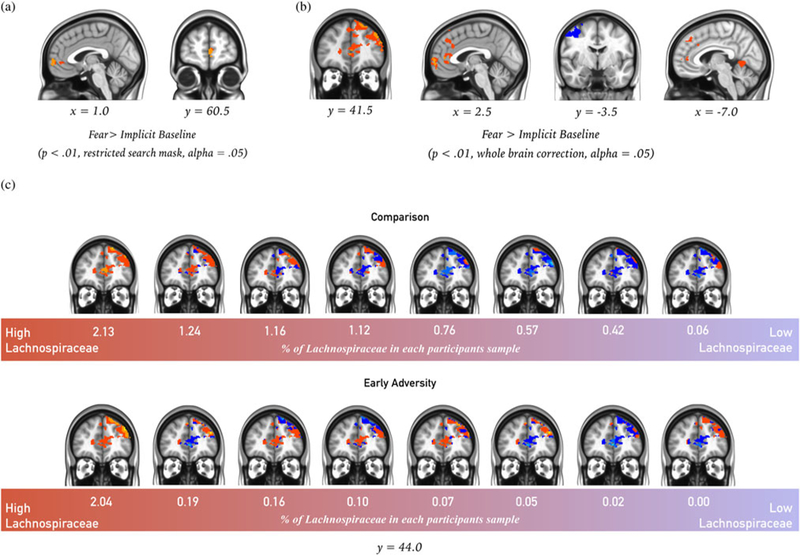
Whole brain statistical maps of thresholded reactivity to fear faces over implicit baseline in whole brain regression with (a) Bacteroides or (b) Lachnospiraceae as the regressor of interest. Warm colors indicate a positive association between Bacteroides or Lachnospiraceae and activity to fear faces, whereas cold colors indicate a negative association. (a) Reactivity in the medial prefrontal cortex (mPFC). (b) Reactivity in the left lateral prefrontal cortex (lPFC), mPFC, precuneus, and posterior cingulate cortex (PCC)/cerebellum. (c) Individual subject statistical maps masked with the group cluster map, showing unthresholded reactivity in left lPFC and mPFC, with comparison individuals featured in the top row and early adversity exposed individuals featured in the bottom row. Individual subject level of Lachnospiraceae is written underneath each subject’s statistical map with high Lachnospiraceae levels to the left and low Lachnospiraceae levels to the right.
Brain-bacteria associations: Biomarker approach using genus Lachnospiraceae
To establish associations between gastrointestinal bacteria that acted as a biomarker for caregiving history, we performed another whole-brain analysis (fear > implicit baseline), but this time using Lachnospiraceae as the regressor of interest. Lachnospiraceae was selected for this analysis, as it was the biomarker with the greatest amount of taxonomic information available. Individual levels of Lachnospiraceae exhibited positive associations with the left lateral prefrontal cortex (PFC), medial PFC (mPFC), precuneus/cerebellum, and negative correlation with the post central gyrus; all p <.01, whole brain corrected; Figure 7b–c; see Table 4 for peak and center of mass coordinates for the whole-brain thresholded maps).
Table 4.
Voxel number, center of mass, and peak coordinates (in the X, Y, Z directions) for clusters passing significance threshold for the group analyses associating brain reactivity to fear faces with individual Bacteroides and Lachnospiraceae levels
| Cluster region | Voxel number | Center mass |
Peak |
||||
|---|---|---|---|---|---|---|---|
| X | Y | Z | X | Y | Z | ||
|
| |||||||
| Bacteroides | |||||||
|
| |||||||
| mPFC | 201 | 4.8 | 53.2 | −0.1 | 2 | 62 | −2 |
|
| |||||||
| Lachnospiraceae | |||||||
|
| |||||||
| Left lateral PFC | 1749 | 28.9 | 43 | 30.70 | 32 | 58 | 26 |
|
| |||||||
| Precuneus/cerebellum | 1277 | −41 | −2.8 | 53.5 | −40 | 2 | 58 |
|
| |||||||
| mPFC | 915 | 4.3 | 51.8 | 7.8 | 4 | 64 | −2 |
|
| |||||||
| Post central gyrus | 832 | −21.2 | −65.7 | 2.6 | −4 | −60 | 2 |
|
| |||||||
Note: mPFC, medial prefrontal cortex. PFC, prefrontal cortex. N =16.
Assessment of potential confounding variables
Diet.
A bivariate correlation was performed between current diet variables (average protein, carbohydrate, and fat intake) and Bacteroides, Lachnospiraceae, and extracted reactivity estimates (i.e., p values) from the clusters associated with bacteria (Bacteroides-mPFC; Lachnospiraceae-mPFC, left lateral PFC, posterior cingulate cortex, and precuneus; see Table 5 for correlation matrix). Average carbohydrate consumption was positively correlated with the level of Bacteroides (r =.552, p = .01). Entering diet variables into the regression between bacteria and brain did not change any reported associations (see Table 6 for statistics).
Table 5.
Correlation matrix of diet variables (proportion of protein, carbohydrate, and fat in the diet) with bacterial genera (Bocteroides and Lachnospiraceae), and each of the significant clusters of activity in the brain, A/= 16
| Bocteroides | Lachnospiraceae | Carbohydrate | Protein | Fat | mPFC (Bacteroides) |
mPFC (Lachnospiraceae) |
Left IPFC (Lachnospiraceae) |
PCC (Lachnospiraceae) |
PCG (Lachnospiraceae) |
|
|---|---|---|---|---|---|---|---|---|---|---|
|
| ||||||||||
| Bacteroides | 1 | |||||||||
|
| ||||||||||
| Lachnospiraceae | .707** | 1 | ||||||||
|
| ||||||||||
| Carbohydrate | .552* | .426 | 1 | |||||||
|
| ||||||||||
| Protein | .198 | −.042 | .446 | 1 | ||||||
|
| ||||||||||
| Fat | .518 | .332 | .498 | .645** | 1 | |||||
|
| ||||||||||
| mPFC (Bacteroides) | .520* | .528* | .242 | .113 | .124 | 1 | ||||
|
| ||||||||||
| mPFC (Lachnospiraceae) | .366 | .584* | .342 | .156 | .087 | .874** | 1 | |||
|
| ||||||||||
| left IPFC (Lachnospiraceae) | .411 | 722** | .255 | .069 | .061 | .764** | .895** | 1 | ||
|
| ||||||||||
| PCC (Lachnospiraceae) | .518* | .874** | .363 | −.140 | .205 | .606* | .708** | .769** | 1 | |
|
| ||||||||||
| PCG (Lachnospiraceae) | −.371 | .715** | −.408 | −.029 | −.119 | −.711** | −.915** | .905** | .842** | 1 |
|
| ||||||||||
Correlation is significant at the .05 level (2 sided).
Correlation is significant at the .01 level (2 sided).
Table 6.
Statistical table of regressions between bacteria (Bacteroides or Lachnospiraceae) and significant clusters of reactivity in the brain when controlling for potential confounding variables: dietary protein, carbohydrate, fat, child country of origin, child IQ, and child sex
| Potential confounder entered into regression |
Bacteria (X) | Brain region (Y) | Statistics for the regression between bacteria and brain with confounder included |
|||
|---|---|---|---|---|---|---|
| β | t | p | 95% confidence interval | |||
| Protein | Bacteroides | mPFC | .01 | 5.04 | .002 | [.01, .02] |
| Lachnospiraceae | mPFC | .48 | 4.59 | .003 | [.23, .73] | |
| Left lPFC | .56 | 7.31 | .0002 | [.38, .74] | ||
| Precuneus | −.42 | −5.30 | .001 | [−.61, −.23] | ||
| PCC | .31 | 13.81 | <.0001 | [.26, .37] | ||
| Carbohydrate | Bacteroides | mPFC | .01 | 4.57 | .003 | [.01, .02] |
| Lachnospiraceae | mPFC | .46 | 4.03 | .005 | [.19, .73] | |
| Left lPFC | .56 | 6.70 | .0002 | [.36, .76] | ||
| Precuneus | −.39 | −4.60 | .002 | [−.59, −.19] | ||
| PCC | .31 | 11.41 | <.0001 | [.24, .37] | ||
| Fat | Bacteroides | mPFC | .02 | 6.12 | .0004 | [.01, .02] |
| Lachnospiraceae | mPFC | .55 | 5.76 | .001 | [.32, .77] | |
| Left lPFC | .60 | 8.84 | <.0001 | [.44, .77] | ||
| Precuneus | −.46 | −6.03 | .001 | [−.65, −.28] | ||
| PCC | .32 | 13.83 | <.0001 | [.27, .38] | ||
| Country of origin | Bacteroides | mPFC | .01 | 5.43 | .0004 | [.01, .02] |
| Lachnospiraceae | mPFC | .47 | 5.01 | .001 | [.26, .67] | |
| Left lPFC | .55 | 7.92 | <.0001 | [.39, .71] | ||
| Precuneus | −.41 | −5.56 | .0003 | [−.58, −.25] | ||
| PCC | .30 | 6.56 | .0001 | [.19, .40] | ||
| IQ | Bacteroides | mPFC | .01 | 5.72 | .0004 | [.01, .02] |
| Lachnospiraceae | mPFC | .49 | 5.98 | .0003 | [.30, .67] | |
| Left lPFC | .56 | 10.88 | <.0001 | [.44, .68] | ||
| Precuneus | −.42 | −6.25 | .0002 | [−57, −26] | ||
| PCC | .29 | 6.39 | .0002 | [.19, .40] | ||
| Sex | Bacteroides | mPFC | .01 | 4.57 | .001 | [.01, .02] |
| Lachnospiraceae | mPFC | .49 | 4.03 | .003 | [.21, .76] | |
| Left lPFC | .53 | 6.05 | .0002 | [.33, .72] | ||
| Precuneus | −.33 | −3.86 | .004 | [−.52, −.48] | ||
| PCC | .24 | 4.73 | .001 | [.13, .36] | ||
Participant demographics.
Entering participant demographic variables (country of origin, IQ, and sex) into the regression did not change the association of Bacteroides with mPFC reactivity (see Table 6 for statistics). Similarly, those demographic variables did not change the relationship between Lachnospiraceae and mPFC, left lateral PFC, precuneus, and posterior cingulate cortex (see Table 6 for statistics).
Discussion
Several studies have noted the strong association between gastrointestinal and mental health (Lee et al., 2009; Mak et al., 2012). Moreover, the association of gastrointestinal and mental health problems with experiences of early adversity is well established (at least in adults; Bradford et al., 2012; Chitkara et al., 2008; Park et al., 2016). Stress programming effects at the level of the gastrointestinal microbiome and brain have been posited as potential biological mechanisms through which such associations emerge, with rodent models demonstrating the strongest evidence to this effect (Callaghan, 2017; Foster & Neufeld, 2013; O’Mahony, Hyland, Dinan, & Ciyan, 2011). However, while it is probable that early adversity effects on gastrointestinal and mental health manifest early in life, much of the research on this topic has been performed in adults, relying on retrospective reports of childhood adversity experiences, which lack the accuracy of prospective designs and have been shown to often reflect adult mental health state (Reuben et al., 2016; Susser & Widom, 2012). In addition, such studies lack the ability to isolate the effects of stress on gastrointestinal health to the early life period.
In the current study, we examined associations between adversity exposure in infancy and gastrointestinal symptoms across childhood and adolescence in a unique population where the end date of adversity is known: youth who received foster or institutional care before international adoption. Similar to past research in rodents (Yi et al., 2017), we observed that early adversity was associated with gastrointestinal symptoms in youth aged 3–18 years (with the largest effects observed in late childhood). In addition to those findings, we observed that GI distress at the Time 1 assessment was associated with concurrent anxiety, as well as with future anxiety (measured over a 5-year time frame), over and above the persistence of GI distress and baseline anxiety scores. Within the cross-sectional data (where the largest number of data points were observed) we also saw that GI distress mediated the association between early adversity and elevated anxiety symptoms, demonstrating that the indirect pathway from caregiving adversity to elevated anxiety through concurrently increased GI distress explains a significant amount of the variance in the adversity-anxiety association. Moreover, we obtained proof of concept that the gastrointestinal microbiome was altered by early experiences of adverse caregiving, and that such microbial variation was associated with brain reactivity within emotion net-works in the brain: the prefrontal cortex, posterior cingulate cortex, and precuneus.
Research in adults has shown that early adversity is associated with a constellation of functional gastrointestinal complaints from visceral pain and feelings of sickness to constipation, diarrhea, and bloating (Wu, 2012). In line with that past research, in Study 1 we observed adversity associations with a range of GI symptoms, including those that fell into the “gastrointestinal distress” factor (aches and pains, funny feelings in the stomach, and nausea), and those that fell into the “digestive distress” factor (i.e., vomiting and constipation). In Study 2 we also saw that early adverse caregiving histoiy was associated with the frequency of diarrhea. Nonetheless, in Study 1 only a subset of these GI symptoms (“aches and pains in the stomach,” “funny feelings in the stomach,” and “nausea”) were associated with anxiety (note: items assessing abdominal sensations were excluded from the anxiety assessment to avoid inflated correlations), both concurrently and in the future, suggesting that there is specificity in the GI distress-anxiety association. We suggest that this specific association reflects the bidirectional nature of anxiety and GI distress correlations already reported in the literature. That is, GI distress is likely a correlate, a symptom, and in some cases a cause of anxiety. While the current study did not aim to differentiate between these possibilities, the longitudinal association between GI distress and anxiety supports the use of GI distress as a predictor of future psychopathology, particularly in pediatric primary care settings in which GI distress is a common reason for presentation. The fact that GI distress predicted future anxiety symptoms over and above concurrent anxiety, as well as early adverse caregiving, furthers the proposed clinical utility of measuring GI symptoms, as it suggests that intervening at the level of the GI system could potentially affect future anxiety symptoms, regardless of their etiology. Moreover, the finding that GI distress was a mediator of the adversity-anxiety relationship (cross-sectionally) suggests that addressing GI symptoms may be especially important in treating elevated anxiety within adversity-exposed populations. Although EA youth as a group had higher anxiety levels than comparisons, these differences were dampened in those experiencing lower GI distress, providing a diagnostic marker that may be more readily available to clinicians as well as health workers outside of the psychology/psychiatry field.
While there are several possible mechanisms through which caregiving adversity, GI distress, and anxiety may be associated, one candidate with strong clinical promise is the GI microbiome. In Study 2, we obtained proof-of-concept that adversity is associated with altered microbial patterns in developing youth, and that bacteria-brain associations are observable within task-based functional reactivity (emotional faces probe task) particularly in brain regions well known to be implicated in emotional functioning (prefrontal cortex and posterior cingulate cortex; Bush, Luu, & Posner, 2000; Hiser & Koenigs, 2018). Moreover, by using adversity-associated (Lachnospiraceae) and adversity-independent (Bacteroides) bacteria, we observed microbiome-brain associations that may be a biomarker or fingerprint of adversity exposure, as well as those that may be somewhat experience independent (i.e., that transcend adversity effects). Rodent models have consistently demonstrated a causal link between early microbial communities and typical brain development, anxiety, and mood (e.g., Clarke et al., 2013; Collins, Kassam, & Bercik, 2013; Hoban et al., 2016; Kelly et al., 2016), and both rodent and monkey models have shown that caregiving stress alters such microbial communities (Bailey & Coe, 1999; O’Mahony et al., 2011). In humans, although previous work has demonstrated correlations between the microbiome and neural phenotypes in adult females and children without a history of adversity (brain structure; Carlson et al., 2018), here we observed brain-microbiome relationships following adverse caregiving in brain regions with known importance for anxiety and mental health and that have been shown in rodent models to exhibit developmental programming in response to the microbiome (e.g., prefrontal cortex). Considering that microbial populations can be easily manipulated (e.g., via probiotics and diet), the association between adversity, microbiome, brain, and anxiety seen here in developing populations has potential clinical value, with significant intervention implications that warrant further investigation.
The fact that early experiences of caregiving adversity increase the risk for both GI and mental health problems, as well as being associated with changes to the GI microbiome, suggests that the timing of this exposure (infancy to early childhood) coincides with the sensitive period for the maturation of each of these systems. While such “sensitive periods” have causal evidence in animal models (e.g., Bailey & Coe, 1999; Heijtz et al., 2011; Neufeld, Kang, Bienenstock, & Foster, 2011), there are few human populations in which the timing of adversity can be isolated to the early life period, making investigation of “sensitive periods” exceedingly difficult. Children who were internationally adopted following early foster or institutional care represent a unique group in which the end date of adversity is known (i.e., the date of adoption), providing a rare opportunity to identify whether such “sensitive periods” operate in human GI and psychosocial health domains. In our study, almost all of the EA children experienced institutional or foster care prior to 13 months of age, but the age at which they were adopted from those care settings was not associated with GI distress or digestive issues. These data suggest that time-limited exposure to caregiving adversities during the infancy-early childhood stages of life, but perhaps not the chronicity of such exposures within this period, may be important for development of the brain-gut-microbiome axis in humans. However, considering that 90% of our EA population was adopted by age 5 years (with median age of adoption at 13 months old), it is also possible that longer durations of foster/institutional care do contribute to enhanced risk for GI health issues that were not captured here. Ascertaining such developmental timing effects will assist in the prevention and targeted treatment of adversity-associated pathology. Moreover, assessing the influence of adversity timing on the composition of GI bacteria will be critically important to examine in future studies with larger sample sizes.
There are some limitations to the current studies. In Study 1, we did not have a direct, validated measure of functional gastrointestinal disorders through which GI symptoms could be assessed. Nonetheless, the questions in the CBCL and RCADS-P do assess functional GI symptoms and were factorable, suggesting that they were assessing an underlying construct. Another limitation was the study design, in which only some children were scheduled for follow-up visits, resulting in a smaller sample size at Time 2 and Time 3 assessments, approximately 2 and 4 years after the Time 1 assessment, respectively. Thus, additional longitudinal studies should confirm the associations observed here. For Study 2, we are limited by the small sample size of the population, and delay between fMRI and microbiome data collection, which occurred as a result of using a convenience sample of children who had already contributed a usable fMRI scan during childhood, and who subsequently agreed to donate a fecal sample. Given some estimates indicating high microbiome stability after approximately 4 years of age (Yatsunenko et al., 2012), it is possible that the fecal sample at time of collection was reflective of earlier bacterial communities. However, it is also possible that the developmental stability of the microbiome may change following stress exposure. These possibilities will need to be examined in future cohorts. In addition, adversity exposure in the current sample is confounded with country of origin, which could influence the microbiome, but participant country of origin was not associated with community composition of the gut, or with microbiome-brain reactivity patterns. Moreover, bacteria were associated with brain reactivity patterns in regions implicated in emotion regulation (e.g., PFC), which are not expected to vary by country of origin. As half of the sample used to examine brain-microbiome associations were previously institutionalized, we have no preadoption information on the incidence of several early life factors known to influence the microbiome, such as mode of birth (vaginal vs. cesarean), pre-and postnatal antibiotic usage, and breastmilk versus formula feeding. However, it is unlikely that any one infancy environment factor alone accounts for the association between caregiving group and microbiome composition reported here. In contrast, some postadoption factors, such as age at adoption, and diet around the time of stool sample, are known and (in future studies with larger sample sizes that have the power to examine individual differences) should be explored as predictors of microbiome composition, and in the case of diet, as a potential ameliorative factor in adversity-associated changes in bacterial composition. Another limitation relates to our amplification of the 16S region of ribosomal RNA to identify bacteria. As other components of the microbiome, including fungi, viruses, and parasites, do not possess the 16S gene, the conclusions of this study are limited to bacteria. Even with these limitations, the current data strongly support further investigation of GI distress in youth as a predictor of future psychopathology, as well as a more general investigation of the gastrointestinal system in foster care, previously institutionalized, and otherwise early adversity-exposed populations of developing youth. In addition, these data support future investigations of the micro-biome-brain functional relationship as a pathway through which adversity may get under the skin to affect the development of emotion neurobiology.
Supplementary Material
Acknowledgments.
The authors thank Dima Amso and Andrew Lynn for help with setting up the fMRI processing pipeline within AFNI and FSL. We thank RTL Genomics for 16s rRNA amplification and sequencing.
Financial support. This research was supported by the National Institute of Mental Health Grant R01MH091864 (to N.T.), Dana Foundation (to N.T.), National Institute of Mental Health Grant 1K99MH113821–01 (to B.C.), National Health and Medical Research Council Early Career Fellowship 1091571 (to B.C.), and American Australian Association Fellowship (to B.C.).
References
- Achenbach TM (1991).Integrativeguide to the 1991 CBCL/4–18, YSR, and TRF Profiles. Burlington, VT: University of Vermont, Department of Psychology. [Google Scholar]
- Ait-Belgnaoui A, Colom A, Braniste V, Ramalho L, Marrot A, Cartier C,… Tompkins T (2014). Probiotic gut effect prevents the chronic psychological stress-induced brain activity abnormality in mice. Neurogastroenterology & Motility, 26, 510–520. doi: 10.1111/nmo.12295 [DOI] [PubMed] [Google Scholar]
- Arumugam M, Raes J, Pelletier E, Le Paslier D, Yamada T, Mende DR, … Bork P (2011). Enterotypes of the human gut microbiome. Nature, 473, 174–180. doi: 10.1038/nature09944 [DOI] [PMC free article] [PubMed] [Google Scholar]
- Bailey MT, & Coe CL (1999). Maternal separation disrupts the integrity of the intestinal microflora in infant rhesus monkeys. Developmental Psychobiology, 35, 146–155. doi: 10.1002/(SICI)1098-2302(199909)35:2<146::AID-DEV7>3.0.CO;2-G [DOI] [PubMed] [Google Scholar]
- Baird AA, Gruber SA, Fein DA, Maas LC, Steingard RJ, Renshaw PF, . Yurgelun-Todd DA (1999). Functional magnetic resonance imaging of facial affect recognition in children and adolescents. Journal of the American Academy of Child & Adolescent Psychiatry, 38, 195–199. doi: 10.1097/00004583-199902000-00019 [DOI] [PubMed] [Google Scholar]
- Belkaid Y, & Hand T (2014). Role of the microbiota in immunity and inflammation. Cell, 157, 121–141. doi: 10.1016/j.cell.2014.03.011 [DOI] [PMC free article] [PubMed] [Google Scholar]
- Bick J, Zhu T, Stamoulis C, Fox NA, Zeanah C, & Nelson CA (2015). Effect of early institutionalization and foster care on long-term white matter development: A randomized clinical trial. Journal of the American Medical Association: Pediatrics, 169, 211–219. doi: 10.1001/jamapediatrics.2014.3212 [DOI] [PMC free article] [PubMed] [Google Scholar]
- Birmaher B, Khetarpal S, Brent D, Cully M, Balach L, Kaufman J, & McKenzie Neer S (1997). The Screen for Child Anxiety Related Emotional Disorders (SCARED): Scale construction and psychometric characteristics. Journal of the American Academy of Child & Adolescent Psychiatry, 36, 545–553. doi: 10.1097/00004583-199704000-00018 [DOI] [PubMed] [Google Scholar]
- Bradford K, Shih W, Videlock EJ, Presson AP, Naliboff BD, Mayer EA, & Chang L (2012). Association between early adverse life events and irritable bowel syndrome. Clinical Gastroenterology and Hepatology, 10, 385–390. doi: 10.1016/j.cgh.2011.12.018 [DOI] [PMC free article] [PubMed] [Google Scholar]
- Brand AE, & Brinich PM (1999). Behavior problems and mental health contacts in adopted, foster, and nonadopted children. Journal of Child Psychology and Psychiatry, 40, 1221–1229. [PubMed] [Google Scholar]
- Bravo JA, Forsythe P, Chew MV, Escaravage E, Savignac HM, Dinan TG, … Cryan JF (2011). Ingestion of Lactobacillus strain regulates emotional behavior and central GABA receptor expression in a mouse via the vagus nerve. Proceedings of the National Academy of Sciences, 108, 16050–16055. doi: 10.1073/pnas.1102999108 [DOI] [PMC free article] [PubMed] [Google Scholar]
- Bush G, Luu P, & Posner MI (2000). Cognitive and emotional influences in anterior cingulate cortex. Trends in Cognitive Sciences, 4, 215–222. doi: 10.1016/S1364-6613(00)01483-2 [DOI] [PubMed] [Google Scholar]
- Callaghan BL (2017). Generational patterns of stress: Help from our microbes? Current Directions in Psychological Science, 26, 323–329. doi: 10.1177/0963721417697737 [DOI] [Google Scholar]
- Callaghan BL, Cowan CSM, & Richardson R (2016). Treating generational stress: Effect of paternal stress on development of memory and extinction in offspring is reversed by probiotic treatment. Psychological Science, 27, 1171–1180. doi: 10.1177/0956797616653103 [DOI] [PubMed] [Google Scholar]
- Callaghan BL, Gee DG, Gabard-Durnam L, Telzer EH, Humphreys KL, Goff B, . Tottenham N (in press). Adoptive parental buffering of amygdala as a resilience factor against future anxiety. Biological Psychiatry: Cognitive Neuroscience and Neuroimaging. [Google Scholar]
- Callaghan BL, & Richardson R (2012). Adverse rearing environments and persistent memories in rats: Removing the brakes on infant fear memory. Translational Psychiatry, 2, e138. doi: 10.1038/tp.2012.65 [DOI] [PMC free article] [PubMed] [Google Scholar]
- Callaghan BL, & Richardson R (2014). Early emergence of adult-like fear renewal in the developing rat after chronic corticosterone treatment of the dam or the pups. BehavioralNeuroscience, 128, 594–602. doi: 10.1037/bne0000009 [DOI] [PubMed] [Google Scholar]
- Callaghan BL, & Tottenham N (2015). The neuro-environmental loop of plasticity: A cross-species analysis of parental effects on emotion circuitry development following typical and adverse caregiving. Neuropsychopharmacology, 41, 163–176. doi: 10.1038/npp.2015.204 [DOI] [PMC free article] [PubMed] [Google Scholar]
- Campo JV, Bridge J, Ehmann M, Altman S, Lucas A, Birmaher B, … Brent DA (2004). Recurrent abdominal pain, anxiety, and depression in primary care. Pediatrics, 113, 817–824. doi: 10.1542/peds.113.4.817 [DOI] [PubMed] [Google Scholar]
- Carlson AL, Xia K, Azcarate-Peril MA, Goldman BD, Ahn M, Styner MA, . Knickmeyer RC (2018). Infant gut microbiome associated with cognitive development. Biological Psychiatry, 83, 148–159. doi: 10.1016/j.biopsych.2017.06.021 [DOI] [PMC free article] [PubMed] [Google Scholar]
- Chitkara DK, van Tilburg MA, Blois-Martin N, & Whitehead WE (2008). Early life risk factors that contribute to irritable bowel syndrome in adults: A systematic review. American Journal of Gastroenterology, 103, 765–774. doi: 10.1111/j.1572-0241.2007.01722.x [DOI] [PMC free article] [PubMed] [Google Scholar]
- Chorpita BF, Moffitt CE, & Gray J (2005). Psychometric properties of the Revised Child Anxiety and Depression Scale in a clinical sample. Behaviour Research and Therapy, 43, 309–322. doi: 10.1016/j.brat.2004.02.004 [DOI] [PubMed] [Google Scholar]
- Clarke G, Grenham S, Scully P, Fitzgerald P, Moloney R, Shanahan F, . Cryan J (2013). The microbiome-gut-brain axis during early life regulates the hippocampal serotonergic system in a sex-dependent manner. Molecular Psychiatry, 18, 666–673. doi: 10.1038/mp.2012.77 [DOI] [PubMed] [Google Scholar]
- Collins SM, Kassam Z, & Bercik P (2013). The adoptive transfer of behavioral phenotype via the intestinal microbiota: Experimental evidence and clinical implications. Current Opinion in Microbiology, 16, 240–245. doi: 10.1016/j.mib.2013.06.004 [DOI] [PubMed] [Google Scholar]
- Cowan CSM, Callaghan BL, & Richardson R (2013). Acute early-life stress results in premature emergence of adult-like fear retention and extinction relapse in infant rats. Behavioral Neuroscience, 127, 703–711. doi: 10.1037/a0034118 [DOI] [PubMed] [Google Scholar]
- Cowan CSM, Callaghan B, & Richardson R (2016). The effects of a probiotic formulation (Lactobacillus rhamnosus and L. helveticus) on developmental trajectories of emotional learning in stressed infant rats. Translational Psychiatry, 6. doi: 10.1038/tp.2016.94 [DOI] [PMC free article] [PubMed] [Google Scholar]
- Cryan JF, & Dinan TG (2012). Mind-altering microorganisms: The impact of the gut microbiota on brain and behaviour. Nature Reviews Neuroscience, 13, 701. doi: 10.1038/nrn3346 [DOI] [PubMed] [Google Scholar]
- Edgar RC (2010). Search and clustering orders of magnitude faster than BLAST. Bioinformatics, 26, 2460–2461. doi: 10.1093/bioinformatics/btq461 [DOI] [PubMed] [Google Scholar]
- Edgar RC (2013). UPARSE: Highly accurate OTU sequences from microbial amplicon reads. Nature Methods, 10, 996–998. doi: 10.1038/nmeth.2604 [DOI] [PubMed] [Google Scholar]
- Edgar RC, Haas BJ, Clemente JC, Quince C, & Knight R (2011). UCHIME improves sensitivity and speed of chimera detection. Bioinformatics, 27, 2194–2200. doi: 10.1093/bioinformatics/btr381 [DOI] [PMC free article] [PubMed] [Google Scholar]
- Felice VD, Gibney SM, Gosselin RD, Dinan TG, O’Mahony SM, & Cryan JF (2014). Differential activation of the prefrontal cortex and amygdala following psychological stress and colorectal distension in the maternally separated rat. Neuroscience, 267, 252–262. doi: 10.1016/j.neuroscience.2014.01.064 [DOI] [PubMed] [Google Scholar]
- Fisher RA (1936). The use of multiple measurements in taxonomic problems. Annals of Eugenics, 7, 179–188. doi: 10.1111/j.1469-1809.1936.tb02137.x [DOI] [Google Scholar]
- Foster JA, & Neufeld K-AM (2013). Gut-brain axis: How the microbiome influences anxiety and depression. Trends in Neurosciences, 36, 305–312. doi: 10.1016/j.tins.2013.01.005 [DOI] [PubMed] [Google Scholar]
- Garber J, Zeman J, & Walker LS (1990). Recurrent abdominal pain in children: Psychiatric diagnoses and parental psychopathology. Journal of the American Academy of Child & Adolescent Psychiatry, 29, 648–656. doi: 10.1097/00004583-199007000-00021 [DOI] [PubMed] [Google Scholar]
- Gareau MG, Jury J, MacQueen G, Sherman PM, & Perdue MH (2007). Probiotic treatment of rat pups normalizes corticosterone release and ameliorates colonic dysfunction induced by maternal separation. Gut, 56, 1522–1528. doi: 10.1136/gut.2006.117176 [DOI] [PMC free article] [PubMed] [Google Scholar]
- Gee DG, Gabard-Durnam LJ, Flannery J, Goff B, Humphreys KL, Telzer EH, . Tottenham N (2013). Early developmental emergence of human amygdala-prefrontal connectivity after maternal deprivation. Proceedings of the National Academy of Sciences of the United States of America, 110, 15638–15643. doi: 10.1073/pnas.1307893110 [DOI] [PMC free article] [PubMed] [Google Scholar]
- Gee DG, Humphreys KL, Flannery J, Goff B, Telzer EH, Shapiro M, … Tottenham N (2013). A developmental shift from positive to negative connectivity in human amygdala-prefrontal circuitry. Journal of Neuroscience, 33, 4584–4593. doi: 10.1523/JNEUROSCI.3446-12.2013 [DOI] [PMC free article] [PubMed] [Google Scholar]
- Goff B, Gee DG, Telzer EH, Humphreys KL, Gabard-Durnam L, Flannery J, & Tottenham N (2013). Reduced nucleus accumbens reactivity and adolescent depression following early-life stress. Neuroscience, 249, 129–138. doi: 10.1016/j.neuroscience.2012.12.010 [DOI] [PMC free article] [PubMed] [Google Scholar]
- Green JG, McLaughlin KA, Berglund PA, Gruber MJ, Sampson NA, Zaslavsky AM, & Kessler RC (2010). Childhood adversities and adult psychiatric disorders in the national comorbidity survey replication: I. Associations with first onset of DSM-IV disorders. Archives of General Psychiatry, 67, 113–123. doi: 10.1001/archgenpsychiatry.2009.186 [DOI] [PMC free article] [PubMed] [Google Scholar]
- Gunnar MR, Bruce J, & Grotevant HD (2000). International adoption of institutionally reared children: Research and policy. Development and Psychopathology, 12, 677–693. [DOI] [PubMed] [Google Scholar]
- Hanson JL, Adluru N, Chung MK, Alexander AL, Davidson RJ, & Pollak SD (2013). Early neglect is associated with alterations in white matter integrity and cognitive functioning. Child Development, 84, 1566–1578. doi: 10.1111/cdev.12069 [DOI] [PMC free article] [PubMed] [Google Scholar]
- Hayes AF (2012). PROCESS: A versatile computational tool for observed variable mediation, moderation, and conditional process modeling. Unpublished manuscript, University of Kansas. [Google Scholar]
- Heijtz RD, Wang S, Anuar F, Qian Y, Björkholm B, Samuelsson A, … Pettersson S (2011). Normal gut microbiota modulates brain development and behavior. Proceedings of the National Academy of Sciences, 108, 3047–3052. doi: 10.1073/pnas.1010529108 [DOI] [PMC free article] [PubMed] [Google Scholar]
- Hiser J, & Koenigs M (2018). The multifaceted role of the ventromedial pre-frontal cortex in emotion, decision making, social cognition, and psychopathology. Biological Psychiatry, 83, 638–647. doi: 10.1016/j.biopsych.2017.10.030 [DOI] [PMC free article] [PubMed] [Google Scholar]
- Hoban AE, Stilling RM, Moloney MG, Moloney RD, Shanahan F, Dinan TG, . Clarke G (2017). Microbial regulation of microRNA expression in the amygdala and prefrontal cortex. Microbiome, 5, 102. doi: 10.1186/s40168-017-0321-3 [DOI] [PMC free article] [PubMed] [Google Scholar]
- Hoban AE, Stilling RM, Moloney G, Shanahan F, Dinan TG, Clarke G, & Cryan JF (2018). The microbiome regulates amygdala-dependent fear recall. Molecular Psychiatry, 23, 1134–1144. doi: 10.1038/mp.2017.100 [DOI] [PMC free article] [PubMed] [Google Scholar]
- Hoban AE, Stilling RM, Ryan FJ, Shanahan F, Dinan TG, Claesson MJ, . Cryan JF (2016). Regulation of prefrontal cortex mye-lination by the microbiota. Translational Psychiatry, 6, e774. doi: 10.1038/tp.2016.42 [DOI] [PMC free article] [PubMed] [Google Scholar]
- Hodel AS, Hunt RH, Cowell RA, Van Den Heuvel SE, Gunnar MR, & Thomas KM (2015). Duration of early adversity and structural brain development in post-institutionalized adolescents. Neuroimage, 105, 112–119. doi: 10.1016/j.neuroimage.2014.10.020 [DOI] [PMC free article] [PubMed] [Google Scholar]
- Huse SM, Mark Welch DB, Voorhis A, Shipunova A, Morrison HG, Eren AM, & Sogin ML (2014). VAMPS: A website for visualization and analysis of microbial population structures. BMC Bioinformatics, 15. doi: 10.1186/1471-2105-15-41 [DOI] [PMC free article] [PubMed] [Google Scholar]
- Jenkinson M, Beckmann CF, Behrens TE, Woolrich MW, & Smith SM (2012). FSL. Neuroimage, 62, 782–790. [DOI] [PubMed] [Google Scholar]
- Jones MP, Tack J, Van Oudenhove L, Walker MM, Holtmann G, Koloski NA, & Talley NJ (2017). Mood and anxiety disorders precede development of functional gastrointestinal disorders in patients but not in the population. Clinical Gastroenterology and HepatoZogy, 15, 1014–1020. doi: 10.1016/j.cgh.2016.12.032 [DOI] [PubMed] [Google Scholar]
- Kelly JR, Borre Y, O’Brien C, Patterson E, El Aidy S, Deane J, … Moloney G (2016). Transferring the blues: Depression-associated gut microbiota induces neurobehavioural changes in the rat. Journal of Psychiatric Research, 82, 109–118. doi: 10.1016/j.jpsychires.2016.07.019 [DOI] [PubMed] [Google Scholar]
- Kessler RC, Berglund P, Demler O, Jin R, Merikangas KR, & Walters EE (2005). Lifetime prevalence and age-of-onset distributions of DSM-IV disorders in the National Comorbidity Survey Replication. Archives of General Psychiatry, 62, 593–602. doi: 10.1001/archpsyc.62.6.593 [DOI] [PubMed] [Google Scholar]
- Klooker TK, Braak B, Painter RC, de Rooij SR, van Elburg RM, van den Wijngaard RM, . Boeckxstaens GE (2009). Exposure to severe wartime conditions in early life is associated with an increased risk of irritable bowel syndrome: A population-based cohort study. American Journal of Gastroenterology, 104, 2250–2256. doi: 10.1038/ajg.2009.282 [DOI] [PubMed] [Google Scholar]
- Koloski NA, Jones M, & Talley NJ (2016). Evidence that independent gut-to-brain and brain-to-gut pathways operate in the irritable bowel syndrome and functional dyspepsia: A 1-year population-based prospective study. AZimentaryPharmacoZogy & Therapeutics, 44, 592–600. doi: 10.1111/apt.13738 [DOI] [PubMed] [Google Scholar]
- Lee S, Wu J, Ma Y, Tsang A, Guo WJ, & Sung J (2009). Irritable bowel syndrome is strongly associated with generalized anxiety disorder: A community study. Alimentary Pharmacology & Therapeutics, 30, 643–651. doi: 10.1111/j.1365-2036.2009.04074.x [DOI] [PubMed] [Google Scholar]
- Lundqvist D, Flykt A, & Ohman A (1998). KaroZinska directed emotional faces. CD ROM from the Department of Clinical Neuroscience, Psychology Section, Karolinska Institutet. [Google Scholar]
- Lyte M, Li W, Opitz N, Gaykema RP, & Goehler LE (2006). Induction of anxiety-like behavior in mice during the initial stages of infection with the agent of murine colonic hyperplasia Citrobacter rodentium. Physiology and Behavior, 89, 350–357. doi: 10.1016/j.physbeh.2006.06.019 [DOI] [PubMed] [Google Scholar]
- Maheu FS , Dozier M , Guyer AE , Mandell D , Peloso E , Poeth K, … Ernst M (2010). A preliminary study of medial temporal lobe function in youths with a history of caregiver deprivation and emotional neglect. Cognitive, Affective, & Behavioral Neuroscience, 10, 34–49. doi: 10.3758/CABN.10.1.34 [DOI] [PMC free article] [PubMed] [Google Scholar]
- Mak A, Wu J, Chan Y, Chan F, Sung J, & Lee S (2012). Dyspepsia is strongly associated with major depression and generalised anxiety disor-der—A community study. Alimentary Pharmacology & Therapeutics, 36, 800–810. doi: 10.1111/apt.12036 [DOI] [PubMed] [Google Scholar]
- McFerron BA, & Waseem S (2012). Chronic recurrent abdominal pain. Pediatrics in Review, 33, 509–517. [DOI] [PubMed] [Google Scholar]
- McLaughlin KA, Green J, Gruber MJ, Sampson NA, Zaslavsky AM, & Kessler RC (2010). Childhood adversities and adult psychiatric disorders in the national comorbidity survey replication: II. Associations with persistence of DSM-IV disorders. Archives of General Psychiatry, 67, 124–132. doi: 10.1001/archgenpsychiatry.2009.187 [DOI] [PMC free article] [PubMed] [Google Scholar]
- McMurdie PJ, & Holmes S (2013). phyloseq: An R package for reproducible interactive analysis and graphics of microbiome census data. PLOS ONE, 8, e61217. doi: 10.1371/journal.pone.0061217 [DOI] [PMC free article] [PubMed] [Google Scholar]
- Mertz H, Morgan V, Tanner G, Pickens D, Price R, Shyr Y, & Kessler R (2000). Regional cerebral activation in irritable bowel syndrome and control subjects with painful and nonpainful rectal distention. Gastroenterology, 118, 842–848. doi: 10.1016/S0016-5085(00)70170-3 [DOI] [PubMed] [Google Scholar]
- Messaoudi M, Lalonde R, Violle N, Javelot H, Desor D, Nejdi A, . Cazaubiel JM (2011). Assessment of psychotropic-like properties of a probiotic formulation (Lactobacillus helveticus R0052 and Bifidobacterium longum R0175) in rats and human subjects. British Journal of Nutrition, 105, 755–764. doi: 10.1017/S0007114510004319 [DOI] [PubMed] [Google Scholar]
- Neufeld K, Kang N, Bienenstock J, & Foster J (2011). Reduced anxiety-like behavior and central neurochemical change in germ-free mice. NeurogastroenteroZogy&MotiZ/ty, 23,255. doi: 10.1111/j.1365-2982.2010.01620.x [DOI] [PubMed] [Google Scholar]
- Ogbonnaya ES, Clarke G, Shanahan F, Dinan TG, Cryan JF, & O’Leary OF (2015). Adult hippocampal neurogenesis is regulated by the microbiome. Bio/ogicaZ Psychiatry, 78, e7–e9. doi: 10.1016/j.biopsych.2014.12.023 [DOI] [PubMed] [Google Scholar]
- O’Mahony SM, Hyland NP, Dinan TG, & Cryan JF (2011). Maternal separation as a model of brain-gut axis dysfunction. PsychopharmacoZogy, 214, 71–88. doi: 10.1007/s00213-010-2010-9 [DOI] [PubMed] [Google Scholar]
- Park SH, Videlock EJ, Shih W, Presson AP, Mayer EA, & Chang L (2016). Adverse childhood experiences are associated with irritable bowel syndrome and gastrointestinal symptom severity. NeurogastroenteroZogy and MotiZity, 28, 1252–1260. doi: 10.1111/nmo.12826 [DOI] [PMC free article] [PubMed] [Google Scholar]
- Power JD, Barnes KA, Snyder AZ, Schlaggar BL, & Petersen SE (2012). Spurious but systematic correlations in functional connectivity MRI networks arise from subject motion. Neuroimage, 59, 2142–2154. doi: 10.1016/j.neuroimage.2011.10.018 [DOI] [PMC free article] [PubMed] [Google Scholar]
- Rajindrajith S, Devanarayana NM, Lakmini C, Subasinghe V, de Silva DH, & Benninga MA (2014). Association between child maltreatment and constipation: A school-based survey using Rome III criteria. JournaZ of Pediatric GastroenteroZogy and Nutrition, 58, 486–490. doi: 10.1097/MPG.0000000000000249 [DOI] [PubMed] [Google Scholar]
- Repetti RL, Taylor SE, & Seeman TE (2002). Risky families: Family social environments and the mental and physical health of offspring. PsychoZogicaZ BuZZetin, 128, 330. doi: 10.1037/0033-2909.128.2.330 [DOI] [PubMed] [Google Scholar]
- Reuben A, Moffitt TE, Caspi A, Belsky DW, Harrington H, Schroeder F, . Danese A (2016). Lest we forget: Comparing retrospective and prospective assessments of adverse childhood experiences in the prediction of adult health. Journal of Child Psychology and Psychiatry, 57, 1103–1112. doi: 10.1111/jcpp.12621 [DOI] [PMC free article] [PubMed] [Google Scholar]
- Roceri M, Cirulli F, Pessina C, Peretto P, Racagni G, & Riva MA (2004). Postnatal repeated maternal deprivation produces age-dependent changes of brain-derived neurotrophic factor expression in selected rat brain regions. Biological Psychiatry, 55, 708–714. doi: 10.1016/j.biopsych.2003.12.011 [DOI] [PubMed] [Google Scholar]
- Segata N, Izard J, Waldron L, Gevers D, Miropolsky L, Garrett WS, & Huttenhower C (2011). Metagenomic biomarker discovery and explanation. Genome Biology, 12, R60. doi: 10.1186/gb-2011-12-6-r60 [DOI] [PMC free article] [PubMed] [Google Scholar]
- Shelby GD, Shirkey KC, Sherman AL, Beck JE, Haman K, Shears AR, … Walker LS (2013). Functional abdominal pain in childhood and long-term vulnerability to anxiety disorders. Pediatrics, 132, 475–482. [DOI] [PMC free article] [PubMed] [Google Scholar]
- Silvers JA, Lumian DS, Gabard-Durnam L, Gee DG, Goff B, Fareri DS, . Tottenham N (2016). Previous institutionalization is followed by broader amygdala-hippocampal-PFC network connectivity during aversive learning in human development. Journal of Neuroscience, 36, 6420–6430. doi: 10.1523/JNEUR0SCI.0038-16.2016 [DOI] [PMC free article] [PubMed] [Google Scholar]
- Song SJ, Amir A, Metcalf JL, Amato KR, Xu ZZ, Humphrey G, & Knight R (2016). Preservation methods differ in fecal microbiome stability, affecting suitability for field studies. American Society for Microbiology Systems, 1, e00021–00016. doi: 10.1128/mSystems.00021-16 [DOI] [PMC free article] [PubMed] [Google Scholar]
- Susser E, & Widom CS (2012). Still searching for lost truths about the bitter sorrows of childhood. Schizophrenia Bulletin, 38, 672–675. doi: 10.1093/schbul/sbs074 [DOI] [PMC free article] [PubMed] [Google Scholar]
- Tottenham N, Hare TA, Quinn BT, McCarry TW, Nurse M, Gilhooly T, … Eigsti IM (2010). Prolonged institutional rearing is associated with atypically large amygdala volume and difficulties in emotion regulation. Developmental Science, 13, 46–61. doi: 10.1111/j.1467-7687.2009.00852.x [DOI] [PMC free article] [PubMed] [Google Scholar]
- Ursell LK, Metcalf JL, Parfrey LW, & Knight R (2012). Defining the human microbiome. Nutrition Reviews, 70(Suppl 1), S38–S44. doi: 10.1111/j.1753-4887.2012.00493.x [DOI] [PMC free article] [PubMed] [Google Scholar]
- Van Den Dries L, Juffer F, van IJzendoorn MH, Bakermans-Kranenburg MJ, & Alink LR (2012). Infants’ responsiveness, attachment, and indiscriminate friendliness after international adoption from institutions or foster care in China: Application of Emotional Availability Scales to adoptive families. Development and Psychopathology, 24, 49–64. doi: 10.1017/S0954579411000654 [DOI] [PubMed] [Google Scholar]
- Van der Werff S, Pannekoek J, Veer I, van Tol M-J, Aleman A, Veltman D, … Van der Wee N (2013). Resting-state functional connectivity in adults with childhood emotional maltreatment. Psychological Medicine, 43, 1825–1836. doi: 10.1017/S0033291712002942 [DOI] [PubMed] [Google Scholar]
- van IJzendoorn MH, Palacios J, Sonuga-Barke EJ, Gunnar MR, Vorria P, McCall RB,. Juffer F (2011). I. Children in institutional care: Delayed development and resilience. Monographs of the Society for Research in Child Development, 76, 8–30. doi: 10.1111/j.1540-5834.2011.00626.x [DOI] [PMC free article] [PubMed] [Google Scholar]
- Vogelzangs N, Beekman ATF, de Jonge P, & Penninx BWJH (2013). Anxiety disorders and inflammation in a large adult cohort. Translational Psychiatry, 3, e249. doi: 10.1038/tp.2013.27 [DOI] [PMC free article] [PubMed] [Google Scholar]
- Vogelzangs N, de Jonge P, Smit JH, Bahn S, & Penninx BW (2016). Cytokine production capacity in depression and anxiety. Translational Psychiatry, 6, e825. doi: 10.1038/tp.2016.92 [DOI] [PMC free article] [PubMed] [Google Scholar]
- Waworuntu R, Hain H, Chang Q, Thiede L, Hanania T, & Berg B (2014). Dietary prebiotics improve memory and social interactions while reducing anxiety when provided early in life to normally developing rodents (637.5). FASEB Journal, 28(1 Suppl.), 635–637. [Google Scholar]
- Wiik KL, Loman MM, Van Ryzin MJ, Armstrong JM, Essex MJ, Pollak SD, & Gunnar MR (2011). Behavioral and emotional symptoms of post-institutionalized children in middle childhood. Journal of Child Psychology and Psychiatry, 52, 56–63. doi: 10.1111/j.1469-7610.2010.02294.x [DOI] [PMC free article] [PubMed] [Google Scholar]
- Williams CL, Villar RG, Peterson JM, & Burks TF (1988). Stress-induced changes in intestinal transit in the rat: A model for irritable bowel syndrome. Gastroenterology, 94, 611–621. [DOI] [PubMed] [Google Scholar]
- Wu JCY (2012). Psychological co-morbidity in functional gastrointestinal disorders: Epidemiology, mechanisms and management. Journal of Neurogastroenterology and Motility, 18, 13. doi: 10.5056/jnm.2012.18.1.13 [DOI] [PMC free article] [PubMed] [Google Scholar]
- Yatsunenko T, Rey FE, Manary MJ, Trehan I, Dominguez-Bello MG, Contreras M, … Anokhin AP (2012). Human gut microbiome viewed across age and geography. Nature, 486, 222–227. doi: 10.1038/nature11053 [DOI] [PMC free article] [PubMed] [Google Scholar]
- Yi L, Zhang H, Sun H, Zhou L, Chen Y, Xuan L, … Xu, S. (2017). Maternal separation induced visceral hypersensitivity from childhood to adulthood. Journal of Neurogastroenterology and Motility, 23, 306–315. doi: 10.5056/jnm16089 [DOI] [PMC free article] [PubMed] [Google Scholar]
- Zeanah CH, Egger HL, Smyke AT, Nelson CA, Fox NA, Marshall PJ, & Guthrie D (2009). Institutional rearing and psychiatric disorders in Romanian preschool children. American Journal of Psychiatry, 166, 777–785. doi: 10.1176/appi.ajp.2009.08091438 [DOI] [PubMed] [Google Scholar]
Associated Data
This section collects any data citations, data availability statements, or supplementary materials included in this article.