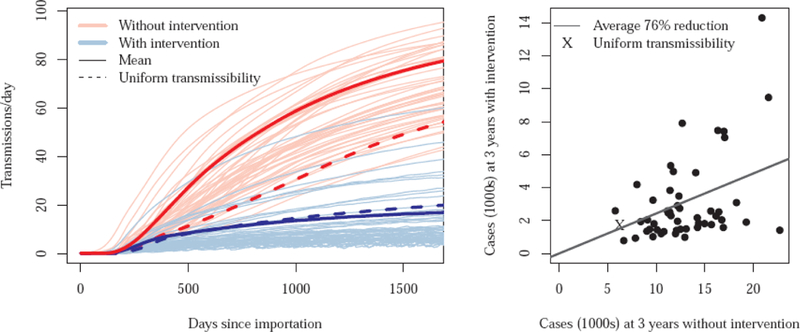
Figure 3.

Left: Trajectories of simulated regional outbreaks with intervention that resulted in a 20% reduction in transmissibility at targeted hospitals, compared to the course of the outbreak with no intervention. Each pair of trajectories (blue and red, with and without containment, respectively) differs from other pairs in transmissibility. Right: Comparison of the number of prevalent cases three years into the outbreak, with and without containment. Each dot (and an “x” for the uniform draw) represents case counts at 3 years with and without intervention for a single draw from the two transmissibility probability distributions (short and long stay).
