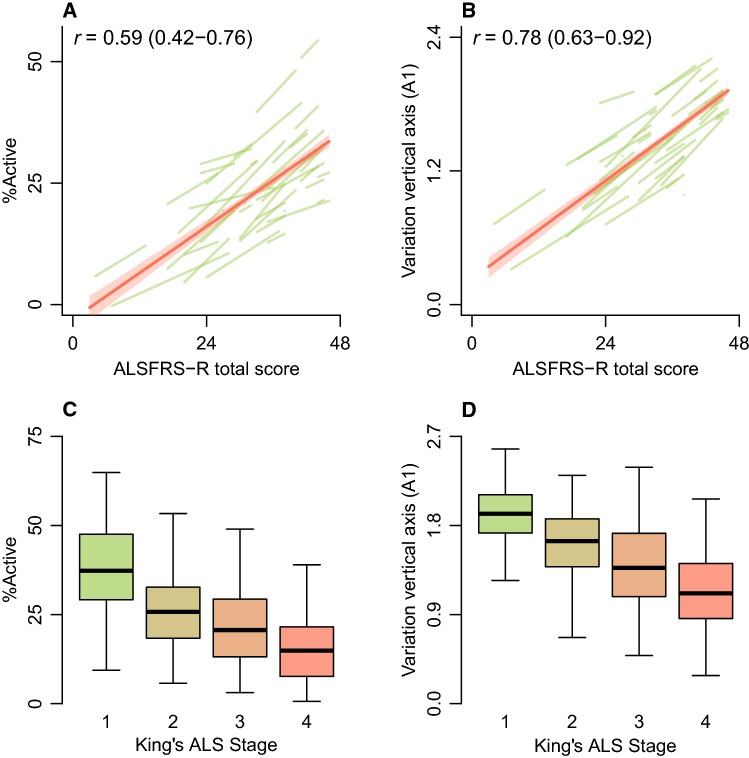
Fig. 2.
Correlation between accelerometer-based outcomes and disease progression. Longitudinal correlation between two accelerometer-based outcomes, %active (a) and variation in the vertical axis (A1, b), with the ALSFRS-R; r = Pearson correlation. The green lines represent the individual patient correlations. c, d Distribution of %active and A1 within clinical stages defined by the King’s ALS staging algorithm [2]

