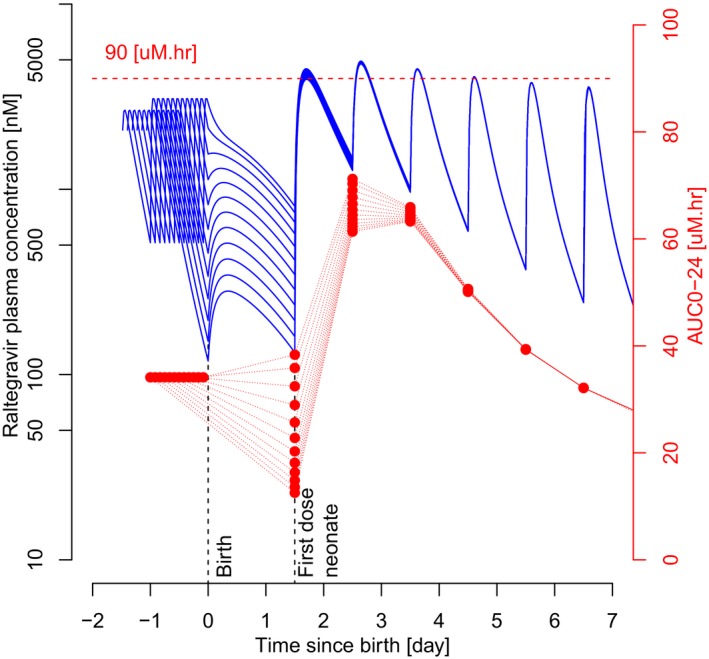
Figure 5.

Influence of the time interval between the last dose administration to the mother and the birth of the neonate on raltegravir area under the plasma concentration‐time curve from dose to 24 hours (AUC0‐24) in the neonate. Red dots represent simulated AUC0‐24, connected by red dotted lines for each neonate. Blue curves represent time‐course pharmacokinetic profiles of the neonate before and after birth, which depend on the time interval between the simulated last dose administered to the mother and delivery (2–24 hours, see Figure 1). First dose in neonate is 36 hours postpartum. Horizontal red‐dotted line is safety criterion set at 90 μM·hour.
