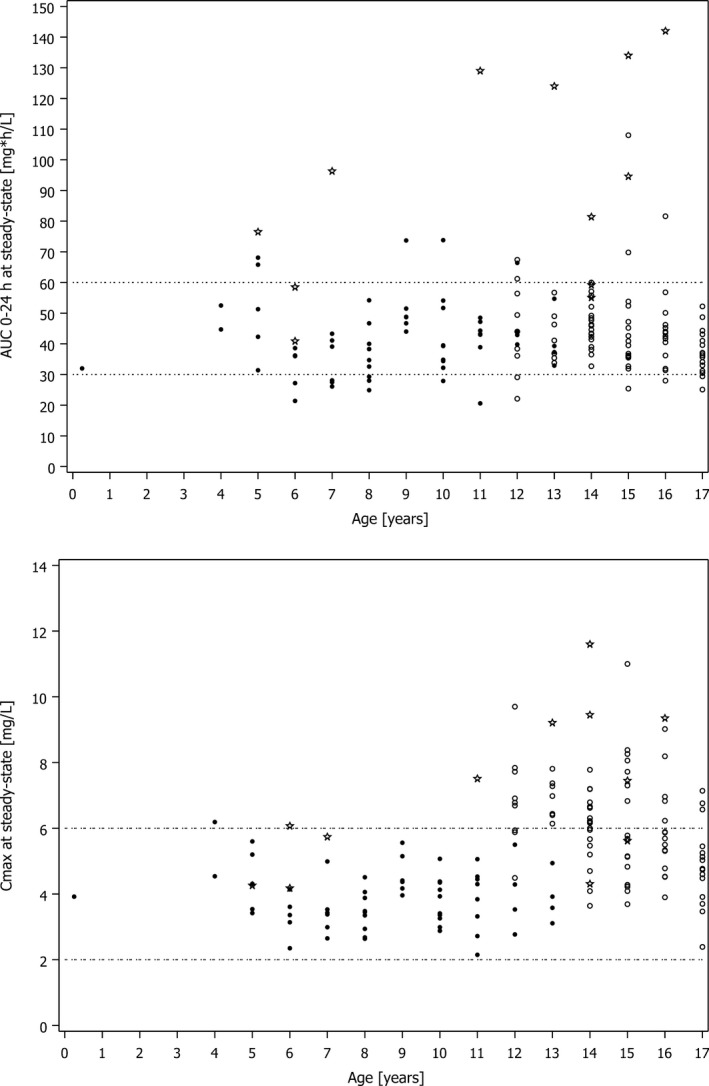
Figure 2.

Pharmacokinetic (PK) parameters at steady state following intravenous (i.v.) administration vs. age in the phase III clinical study based on the population PK model for AUC (0–24 h) and C max . Open circles indicate subjects with multiple‐dose i.v. administration of 400 mg once daily; filled circles, subjects with multiple‐dose i.v. administration of 4–6 mg/kg twice daily; asterisks, subjects with any treatment and with at least one noninfluential outlier; dashed lines, limits of the C max target range. AUC (0–24 h) , 24‐hour area under the concentration‐time curve; C max , maximum plasma concentration.
