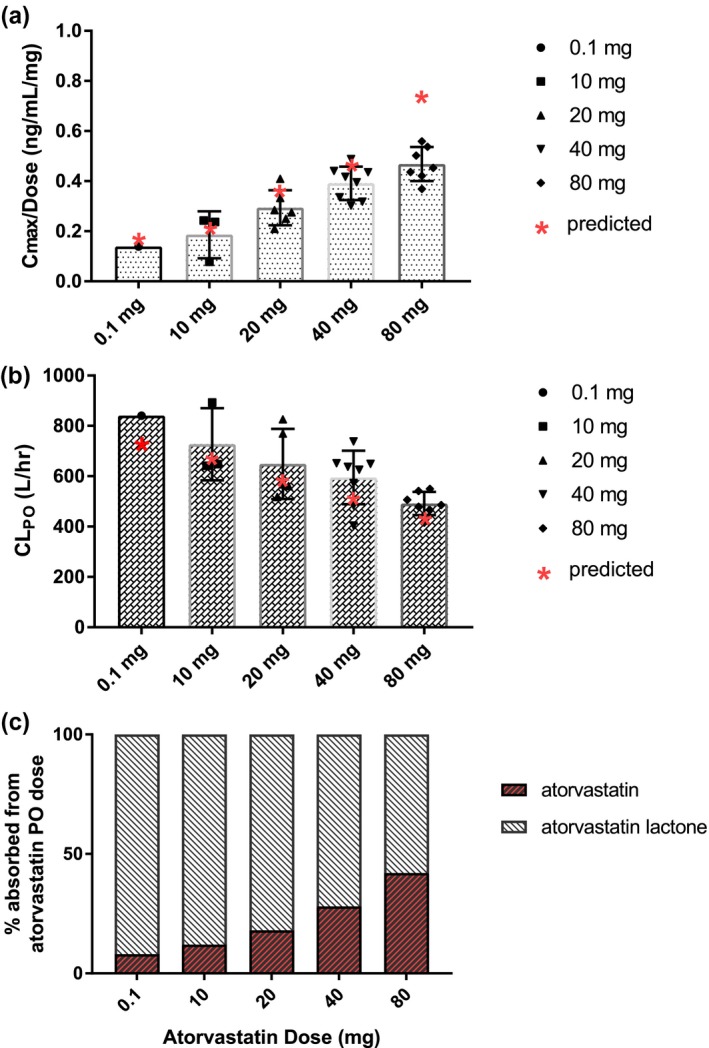
Figure 3.

Dose‐dependent pharmacokinetics of atorvastatin. (a and b) Black symbols represent literature reported mean values. Red symbols represent model‐predicted geometric mean. (c) Model‐predicted percentage of dose absorbed as acid/lactone with incorporation of solubility‐limited stomach degradation in the atorvastatin model. CLPO, oral clearance; Cmax, maximim plasma concentration; hr, hour; p.o., oral.
