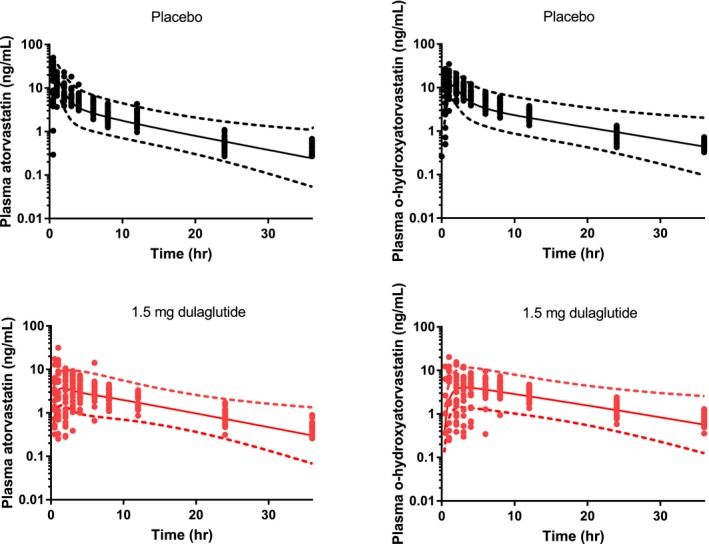
Figure 5.

Predicted and observed concentration profiles for atorvastatin and o‐hydroxyatorvastatin following oral administration of 40 mg atorvastatin in the fasted state with and without 1.5‐mg dulaglutide. Symbols represent observed data, solid lines represent predicted geometric mean concentrations, and dotted lines represent the predicted 90% confidence intervals. hr, hour.
