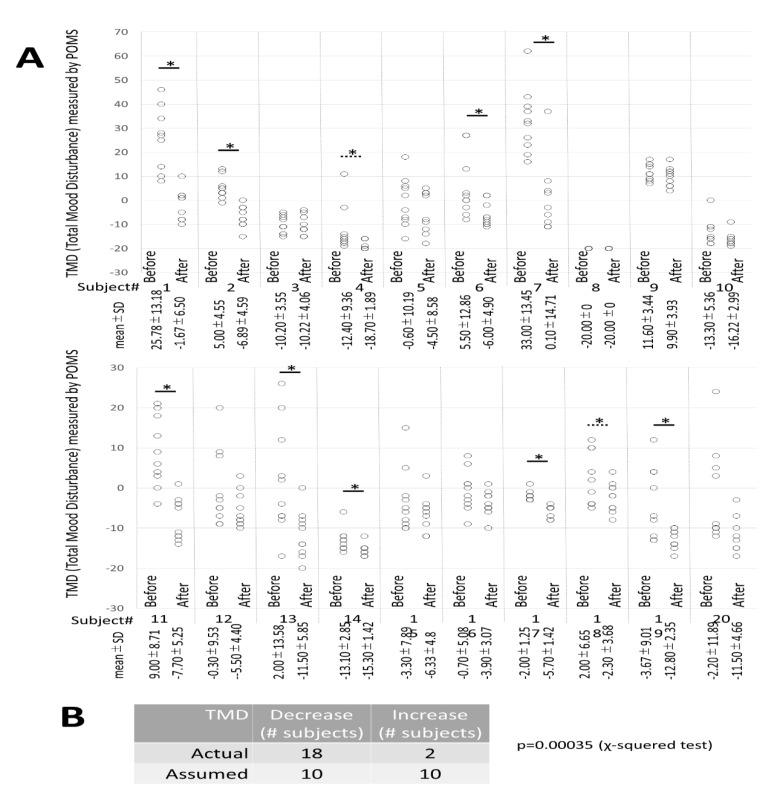
Figure 5.
TMD from POMS2 Questionnaire. (A) The mean ± standard deviation of TMD before and after 10 lessons of the 20 individual subjects is shown. Eight out of twenty subjects showed significantly lower values after the lesson compared with values before the lesson. Two subjects showed a decreasing tendency (0.1 > p > 0.05). (B) A comparison was not made between groups before and after the lesson, but the number of people whose values after and before or after before and after were compared. Assuming that the predicted value would decrease or rise by half, the results indicated a decrease in 18 subjects and a rise in 2 subjects. In the chi-squared test, there were many subjects who dropped significantly (p = 0.00035).

