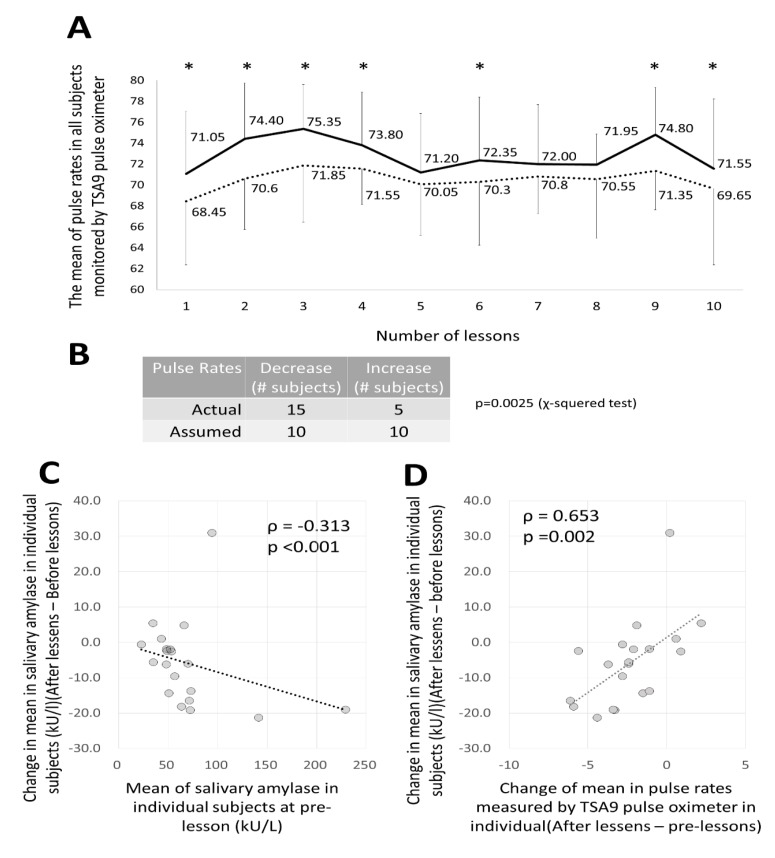
Figure 7.
Pulse changes in subjects before and after lessons and changes in salivary amylase levels that serve as stress indicators. (A) Changes in pulse rate as measured by TAS9VIEW®. The horizontal axis shows the first to the tenth lesson. The solid line shows the average pulse rate of the 20 subjects before each lesson. The dotted line represents the average value after the lesson. The pulse rate decreased significantly, except at the fifth, seventh, and eighth lessons. (B) The average pulse rate for all of the 10 lessons of the 20 subjects: the pulse rate declined in 15 subjects and rose in 5 subjects. The chi-squared test was performed with each half as a predicted value. There were many subjects whose value decreased significantly. (C) For salivary amylase, the horizontal axis shows the average value before each lesson of the 20 subjects, and the vertical axis shows the change in the average values (post-value minus pre-value) before and after the lessons of these subjects. This shows a significant inverse correlation. (D) Horizontal axis: change in pulse rate value of the 20 subjects as measured by TAS9VIEW® (post-value minus pre-value); vertical axis: change in salivary amylase value before and after lessons of the subjects (post-value minus pre-value). This shows a significant positive correlation.

