Figure 8.
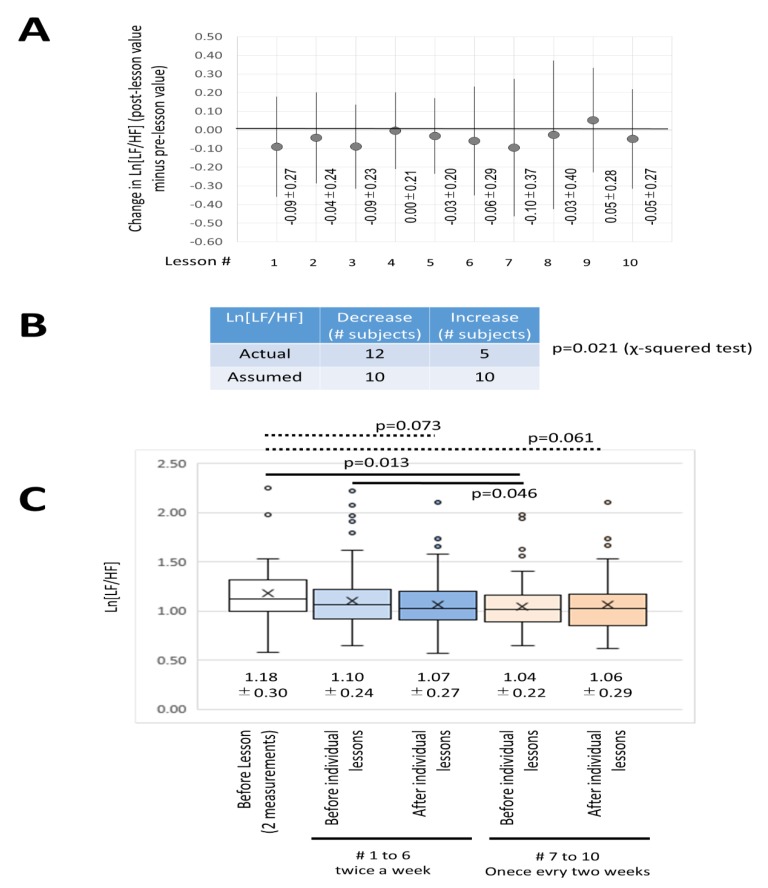
The effect of the DHPM on autonomic balance. (A) Average value of changes in Ln[LF/HF] of the 20 subjects in 10 lessons (post-value minus pre-value). The values declined except in the case of lessons 4 and 9. (B) Chi-squared test assuming that the results of panel A are predicted to have a decline in half and a rise in half. There were many subjects that showed a significant decrease (p = 0.018). (C) In the 10 lessons of the 20 subjects, 12 subjects showed decreased Ln[LF/HF] more often after the lesson than before the lesson, 3 subjects remained unchanged, and 5 subjects showed increased Ln[LF/HF]. A chi-squared test was performed with half of the expected change decreasing and half increasing. Many subjects showed significant decreases (p = 0.021). (D) In an effort to observe the long-term effects of the DHPM, the average, median, and distribution of Ln[LF/HF] of the 20 subjects are shown using a box and whisker plot. From the left, 2 measured values before entering the lesson (row 1), followed by the 1st to 6th measurements, that is, before (row 2) and after (row 3) the lesson when the lesson (the initial (intense) period) is performed twice a week (6 lessons total) and the value before the lesson (row 4) and after value (row 5) of the 7th to 10th lessons (one lesson every 2 weeks, 4 lessons total: the final (more relaxed) period). The solid line indicates the significant difference (p < 0.05), and the dotted line indicates the trend (0.1> p > 0.05).

