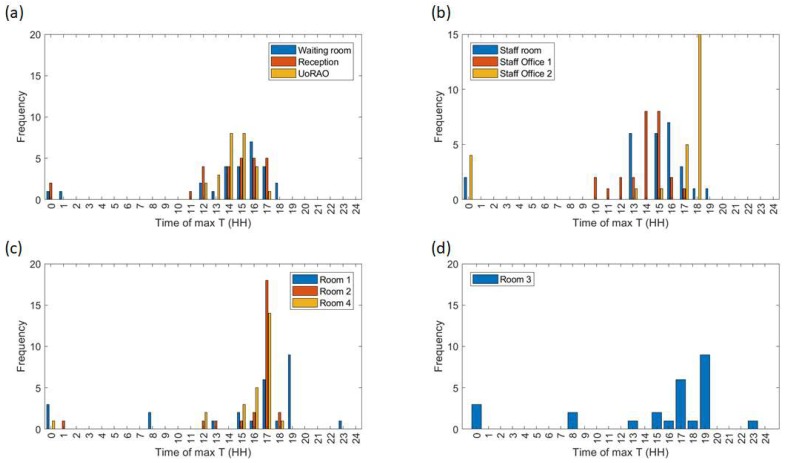
Figure 8.
Hours in which the maximum daily temperatures recorded on the weekdays occur (Figure 9). For clarity, similar rooms are plotted on one subplot, (a) Waiting room, Reception and the observatory (UoRAO), (b) Staff room and Staff offices, (c) Room 1, 2, 4 and (d) Room 3. All plots have the same axis.

