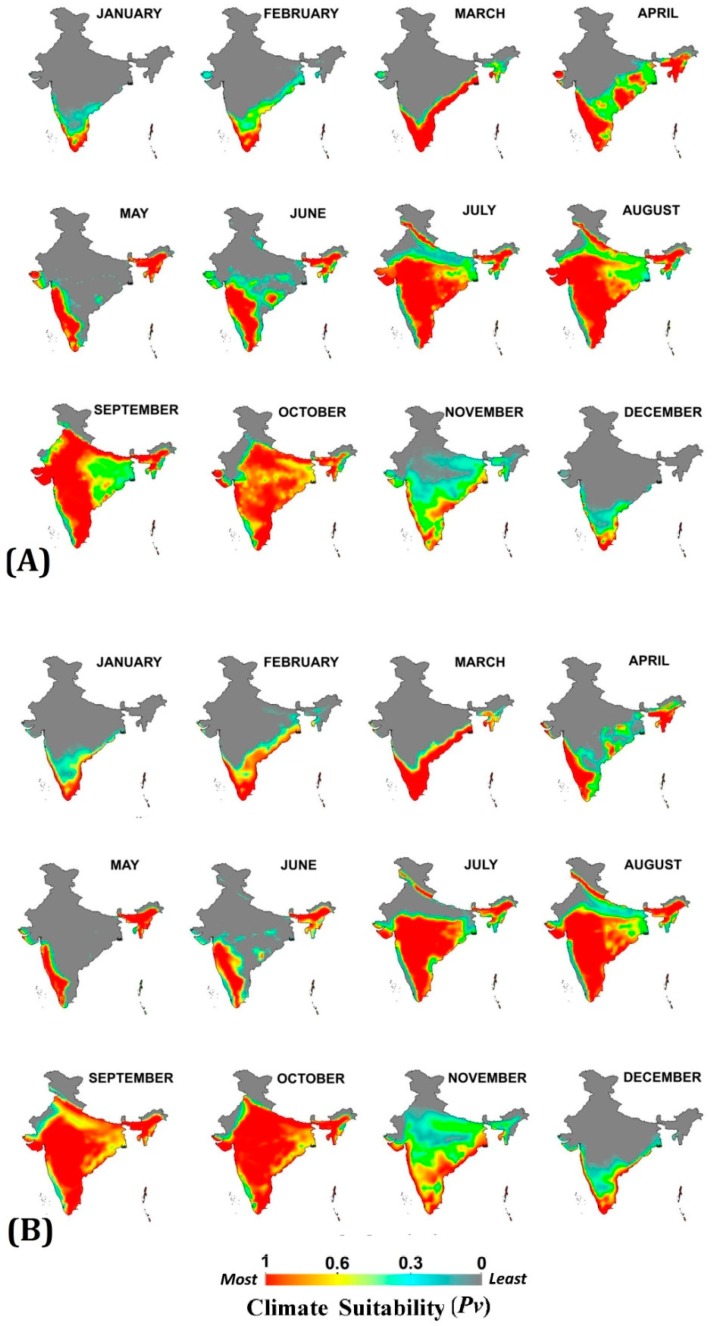
Figure 3.
Monthly climate suitability maps for P. vivax malaria using Temperature and RH combined (A) Baseline (1976–2005) and (B) projected 2030s. Increased climate suitability is visible in the months of September to November, while reduction from April to June under the 2030s scenario, as compared to the baseline.

