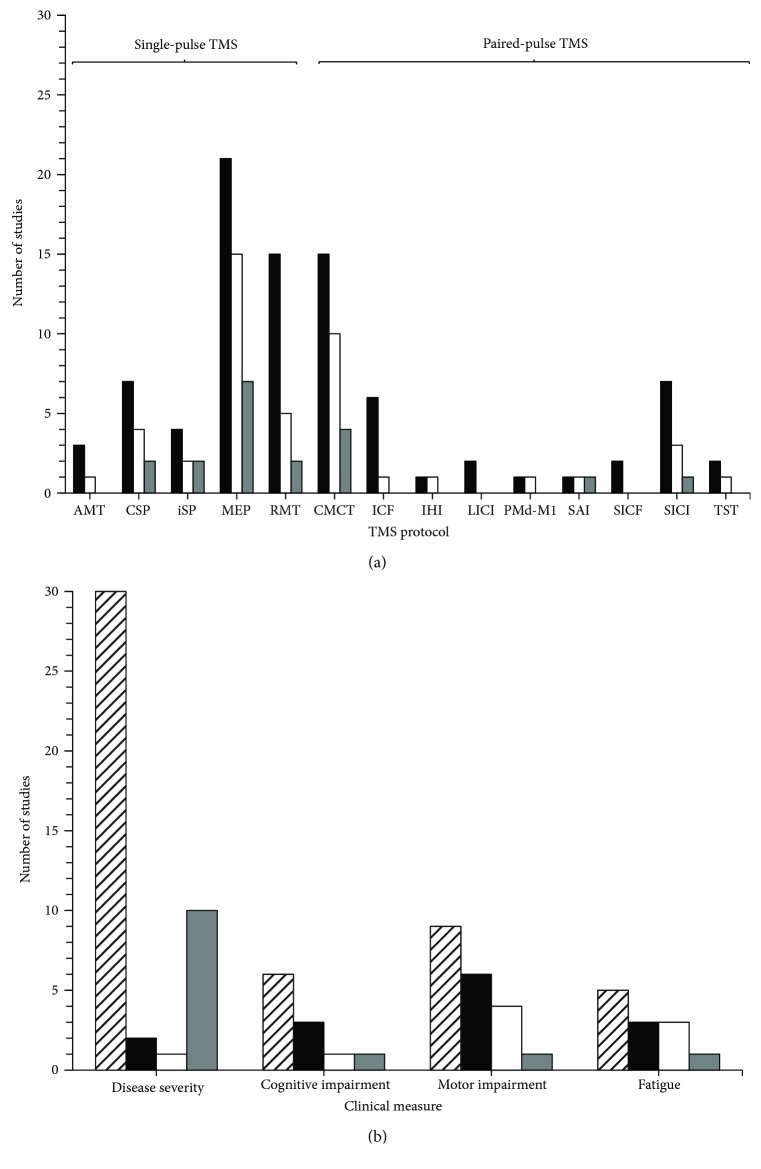
Figure 3.
Summary of (a) transcranial magnetic stimulation (TMS) and (b) clinical outcome measures from studies reviewed. The horizontal axis indicates the outcome measure of interest, and the vertical axis represents number of studies utilizing each outcome measure. The black vertical bars (a and b) represent studies comparing both participants with multiple sclerosis (MS) and healthy control participants (HC). The white vertical bars (a and b) represent studies with statistically significant differences between MS and HC groups. The grey vertical bars (a and b) represent studies that found statistically significant correlations between TMS and clinical outcome measures in participants with MS. The hatched bar (b only) represents studies examining clinical outcome measures in MS participants alone. AMT: active motor threshold; CSP: cortical silent period; iSP: ipsilateral silent period; MEP: motor-evoked potential; RMT: resting motor threshold; CMCT: central motor conduction time; ICF: intracortical facilitation; IHI: interhemispheric inhibition; LICI: long-interval intracortical inhibition; PMd-M1: dorsal premotor cortex-primary motor cortex interactions; SAI: short-latency afferent inhibition; SICF: short-interval intracortical facilitation; SICI: short-interval intracortical inhibition; TST: triple stimulation technique.

