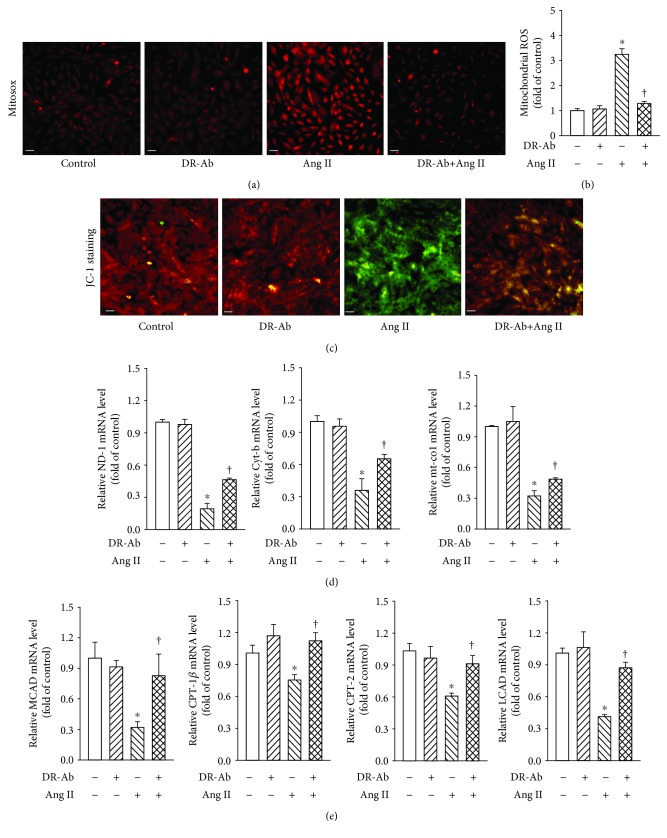
Figure 3.
Effect of DR-Ab on Ang II-induced mitochondrial ROS (mit-ROS) generation and energy metabolic dysfunction. (a, b) Representative image (a) and group data (b) showing that DR-Ab decreased Ang II-induced mit-ROS generation. Red: Mit-ROS. Scale bar, 50 μm. n = 4‐6. (c) Representative JC-1 staining showing that DR-Ab reversed mitochondrial membrane potential loss caused by Ang II. Red: aggregate. Green: monomer. Scale bar, 50 μm. (d) qRT-PCR analysis showing that DR-Ab increased the mRNA expression of mitochondrial encoded genes (ND-1, Cyt-b, and mt-co1) in Ang II-treated cells. n = 4. (e) qRT-PCR analysis showing the effect of DR-Ab on the mRNA expression of fatty acid oxidation related genes (CPT-1β, CPT-2, LCAD, and MCAD). n = 4. ∗p < 0.05 versus control group, †p < 0.05 versus Ang II alone group.

