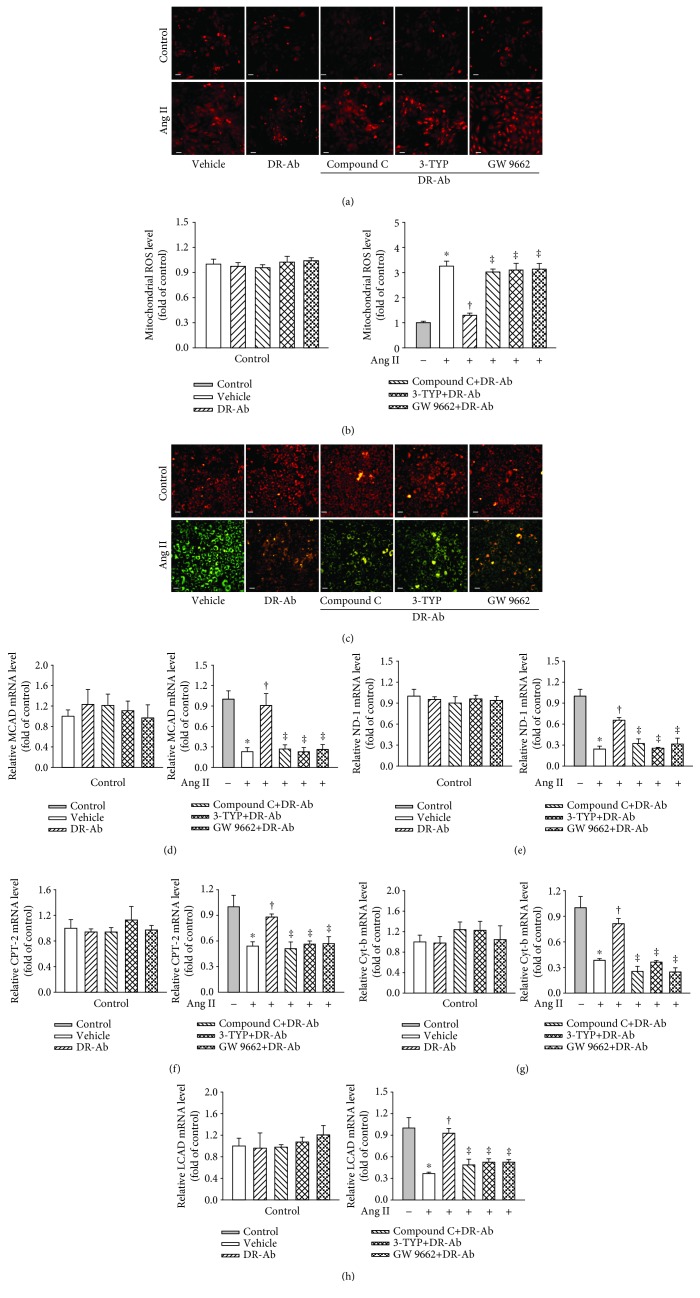
Figure 5.
Effects of DR-Ab on mit-ROS production and energy metabolic dysfunction in Ang II-treated cells in the presence and absence of inhibitors of AMPK, Sirt3, or PPARγ. (a, b) Representative image (a) and statistic data (b) showing that blockade of AMPK, Sirt3, or PPARγ with their inhibitors abolished the protective effect of DR-Ab on mit-ROS production. Red: mit-ROS. Scale bar, 50 μm. n = 4‐6. (c) JC-1 staining showing that blockade of AMPK, Sirt3, or PPARγ reversed the effect of DR-Ab on mitochondrial membrane potential. Red: aggregate. Green: monomer. Scale bar, 50 μm. (d–h) qRT-PCR analysis showing that blockade of AMPK, Sirt3, or PPARγ abolished the effects of DR-Ab on the mRNA expression of ND-1, Cyt-b, CPT-2, LCAD, and MCAD. n = 4‐6. ∗p < 0.05 versus control, †p < 0.05 versus Ang II alone group, ‡p < 0.05 versus Ang II+DR-Ab group.

