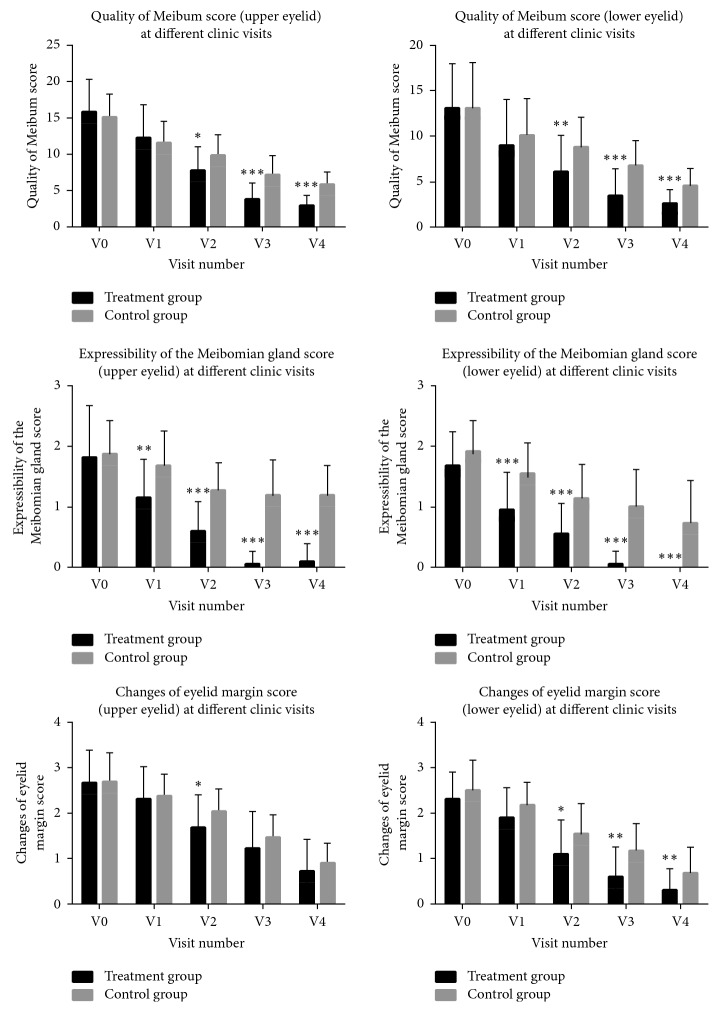
Figure 2.
Comparison of quality of meibum secretion, expressibility of the Meibomian glands, and changes of eyelid margin of upper and lower eyelids between the treatment and control groups at different follow-up time points. The baseline and the four follow-up visits were coded as V0, V1, V2, V3, and V4. ∗p < 0.05, ∗∗p < 0.01, and ∗∗∗p < 0.001.

