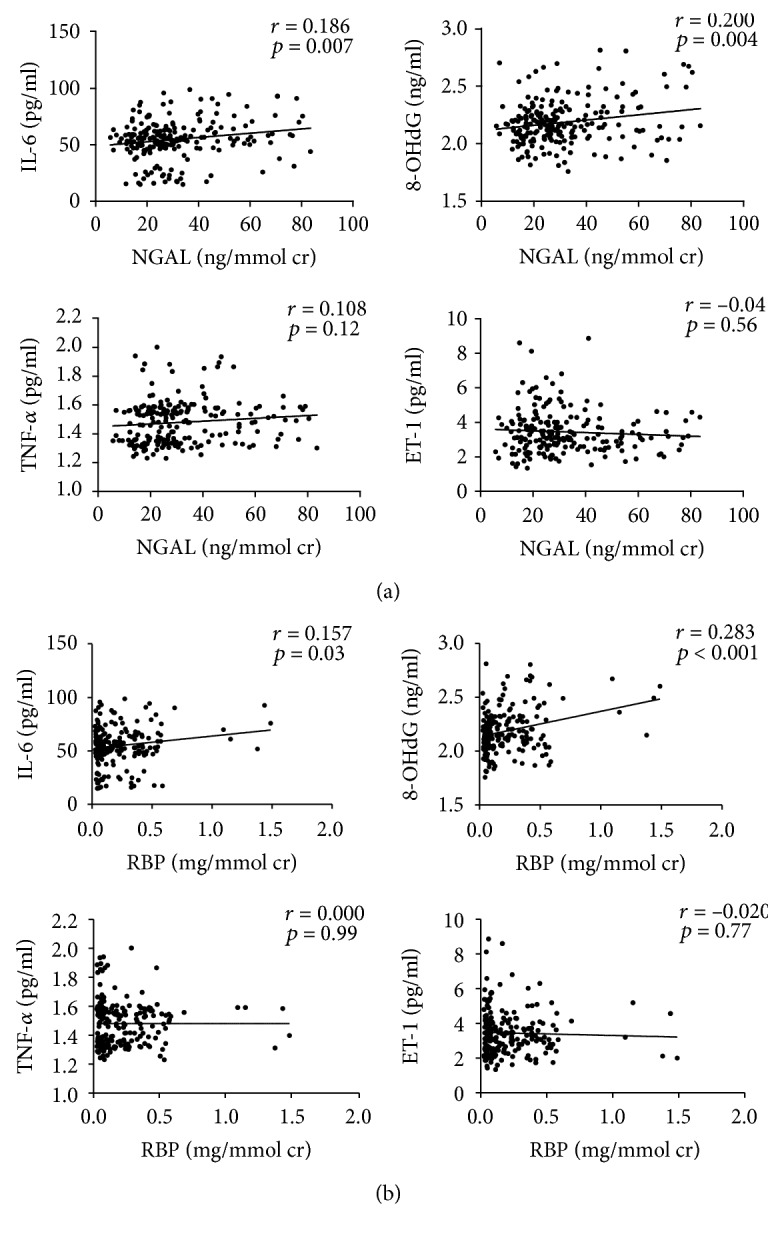
Figure 3.

Correlations between plasma TNF-α, IL-6, ET-1, and 8-OHdG with urinary NGAL and RBP. (a) Single linear regression analysis of plasma TNF-α, IL-6, ET-1, and 8-OHdG and urinary NGAL. (b) Single linear regression analysis of plasma TNF-α, IL-6, ET-1, and 8-OHdG and urinary RBP.
