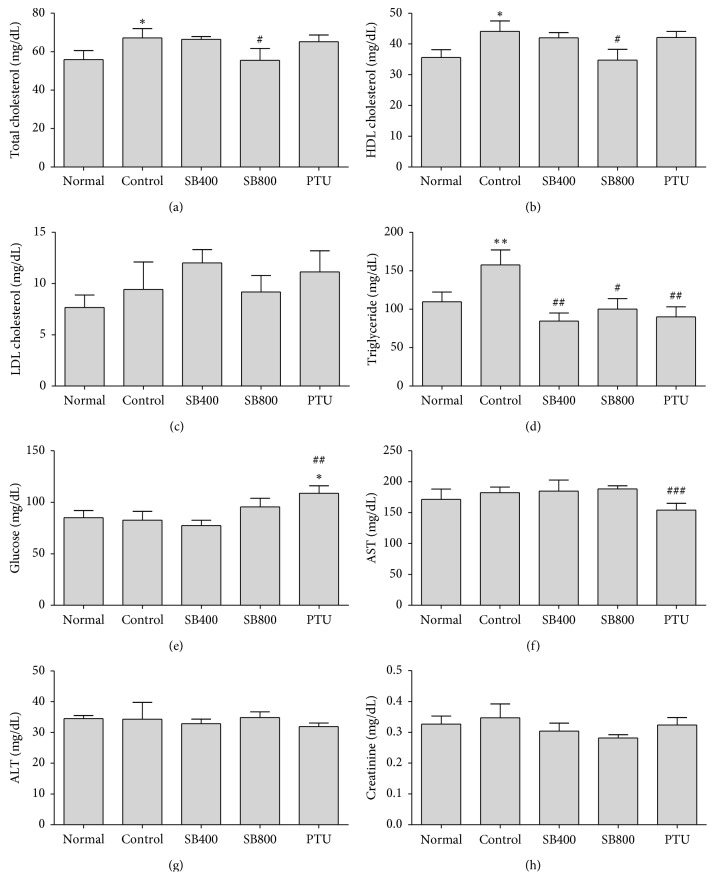
Figure 3.
Effects of SB on total cholesterol (a), HDL cholesterol (b), LDL cholesterol (c), triglyceride (d), glucose (e), aspartate transaminase (AST) (f), alanine aminotransferase (ALT) (g), and creatinine (h). Blood samples were obtained at week 4. N=6 in each group. Data shown as mean ± SEM. ∗P < 0.05, ∗∗P < 0.01 versus Normal group; #P < 0.05, ##P < 0.01, ###P < 0.001 versus Control group.

