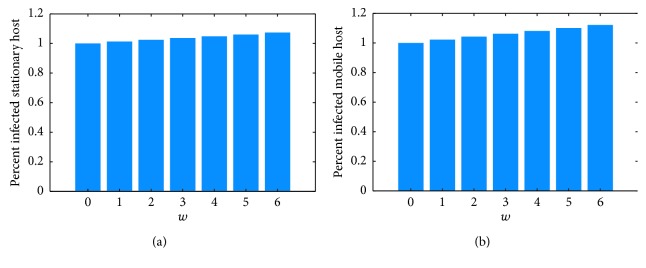
Figure 6.
Response of host-based risk measures to increasing temperature, as percent of control (no temperature rise). (a) Percent infected competent stationary hosts per day averaged over the last year of the simulation, scaled by the same quantity for w = 0 (no temperature rise), i.e., av (CIS/(CUS+CIS))w=i/av(CIS/(CUS+CIS))w=0, i=0, 1,…, 6 (b) Percent infected competent mobile hosts per day averaged over the last year of the simulation, scaled by the same quantity for w = 0 (no temperature rise), i.e., av (CIM/(CUM+CIM))w=i/av(CIM/(CUM+CIM))w=0, i=0, 1,…, 6.

