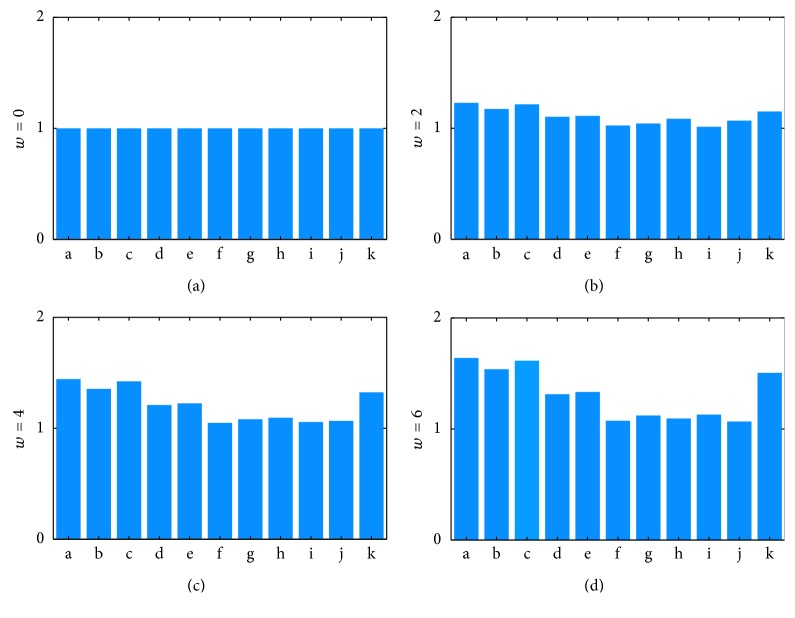
Figure 7.
Response of various risk measures to increasing temperatures (relative to historical temperature, w = 0) for 0, 2, 4, and 6°C temperature increase. Each risk measure is scaled against its own value at w = 0. In this figure, a, b, c, d, e, f, g, h, i, j, and k represent the following: (a) annual average of number of questing nymphs (NI2) at steady state, (b) annual average of infected questing adult ticks (AI2) at steady state, (c) annual average of infected questing ticks (AI2 + NI2) at steady state, (d) annual average of disease prevalence in questing nymphs (NI2/(NI2 + NU2)) at steady state, (e) annual average of disease prevalence in questing adult ticks (AI2/(AI2 + AU2)) at steady state, (f) annual average of disease prevalence in competent stationary hosts (CIS/(CIS + CUS)) at steady state, (g) annual average of disease prevalence in competent mobile hosts (CIM/(CIM + CUM)) at steady state, (h) maximum daily number of infected nymphs (NI2) at steady state, (i) maximum daily number of infected adult ticks (AI2) at steady state, (j) maximum daily number of infected ticks (AI2 + NI2) at steady state, and (k) degree days at steady state.

