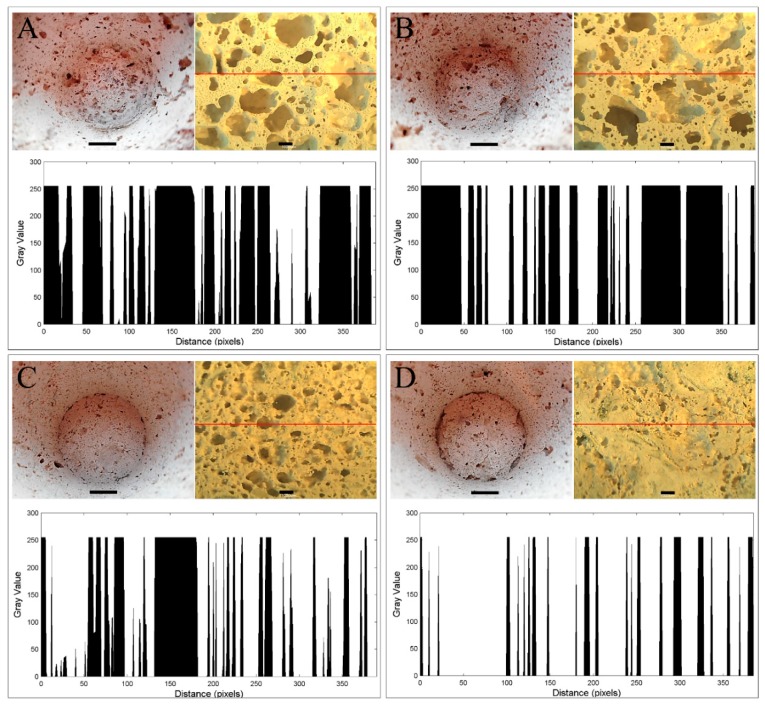
Figure 1.
Macro- and microstructure, size and distribution of the pores in geopolymer pots G (A), GM (B), GC (C), and GCM (D). A marker of 1 cm was set for the inner surface of the pots (volume 100 mL). Marker of 1 mm was set for light microscopy photos. Size and distribution of the pores were measured using the plot profile analysis in the ImageJ 1.52a software (NIH, Bethesda, MD, USA) as a function of pixels number with the defined grey value. The ImageJ analysis was performed along the red lines marking the counterpart light microscopy photos.

