
Figure 1.
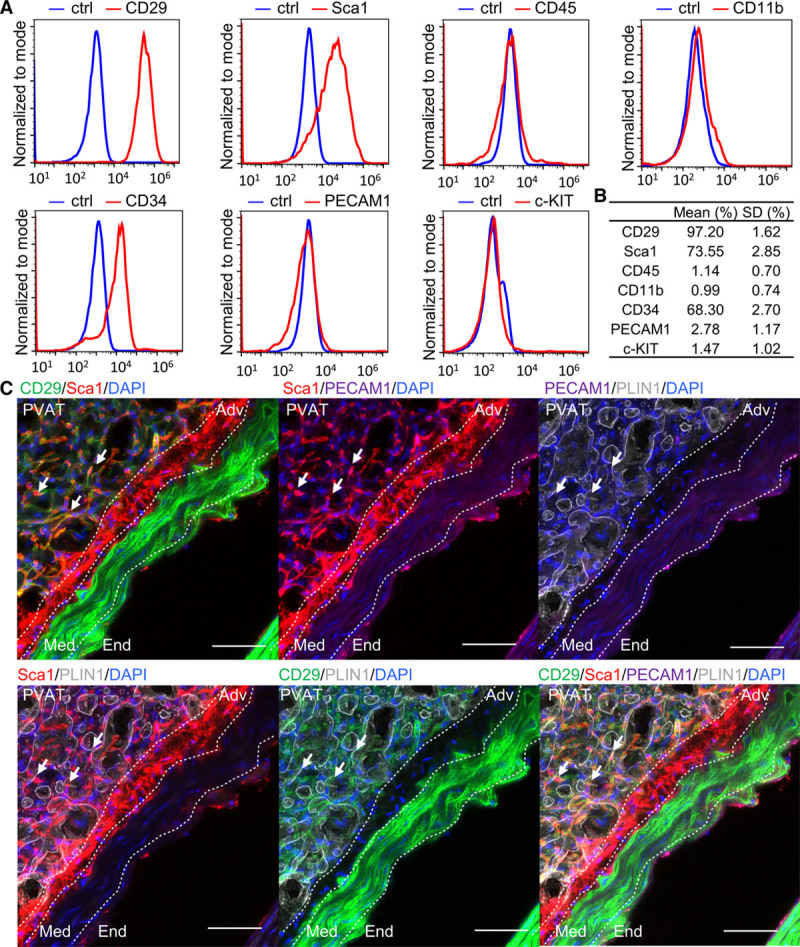
Characterization of perivascular adipose tissue-derived mesenchymal stem cells (PV-ADSCs). A and B, Representative histograms of flow cytometry analysis of cultured PV-ADSCs and the percentage of indicated phenotypic markers (n=3). Gating is set for the IgG control to be between 0.5% and 1%. C, Immunofluorescent staining of the adipose tissue surrounding the mouse aorta with CD29, Sca-1 (stem cell antigen 1), PECAM1 (platelet and endothelial cell adhesion molecule 1), PLIN-1 (perilipin-1), and 4′,6-diamidino-2-phenylindole (DAPI; n=3). Arrows indicate the CD29+/Sca1+/PECAM1−/PLIN1− cells. The border between End (endothelium), Med (media), Adv (adventitia), and perivascular adipose tissue (PVAT) is drawn with dashed line. Scale bar, 50 μm. Ctrl indicates IgG isotype control.