
Figure 3.
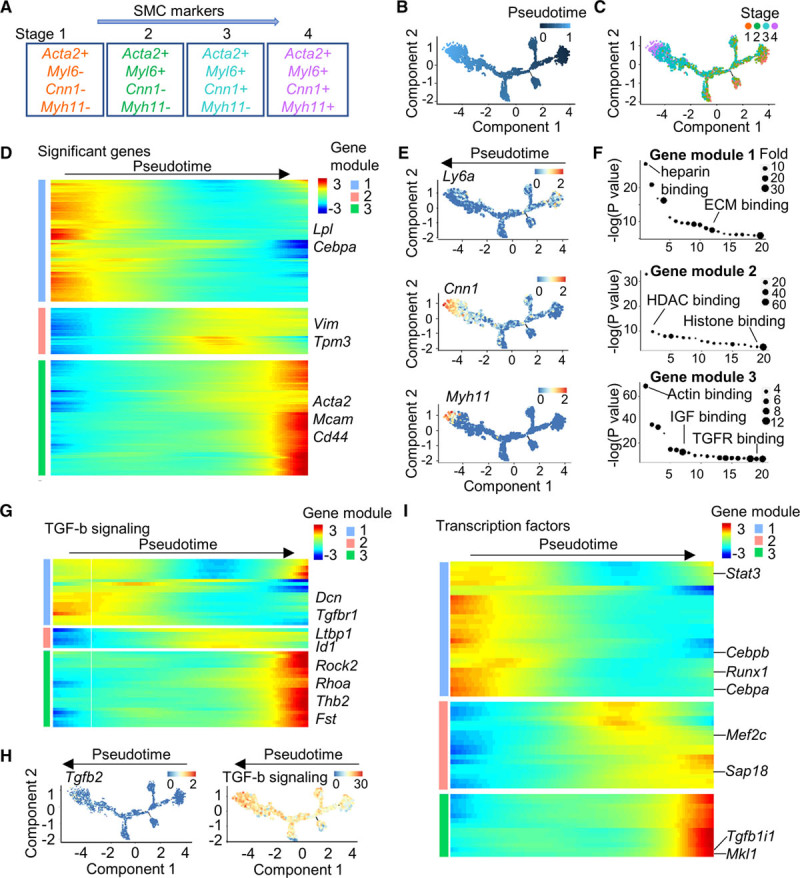
Pseudotime trajectory of cultured perivascular adipose tissue-derived mesenchymal stem cells (PV-ADSCs). A, Cell stages expressing early to late smooth muscle cell (SMC) markers. B, Pseudotime trajectory of cultured PV-ADSCs with DDRTree method for dimension reduction. Color scale, pseudotime. C, Cell ordering from different differentiation stages along the pseudotime trajectory. D, Heatmap of the top 1000 (by Q value) significantly changed genes in 3 gene modules. E, Expression of Ly6a, Cnn1, and Myh11 along the trajectory. Color scale, log gene expression. F, Gene ontology (molecular function) analysis of each gene module from (D). Full list was in Table III in the online-only Data Supplement. G, Expression of significantly changed genes from TGF (transforming growth factor)-β signaling pathway (KEGG) along pseudotime. Full list was in Table I in the online-only Data Supplement. Color scale, log gene expression. H, Tgfb2 expression and total level of significantly changed genes from TGF-β signaling along the pseudotime trajectory. Color scale, log gene expression. I, Expression of significantly changed transcription factors along the pseudotime trajectory. Full list was in Table I in the online-only Data Supplement. Color scale, log gene expression.