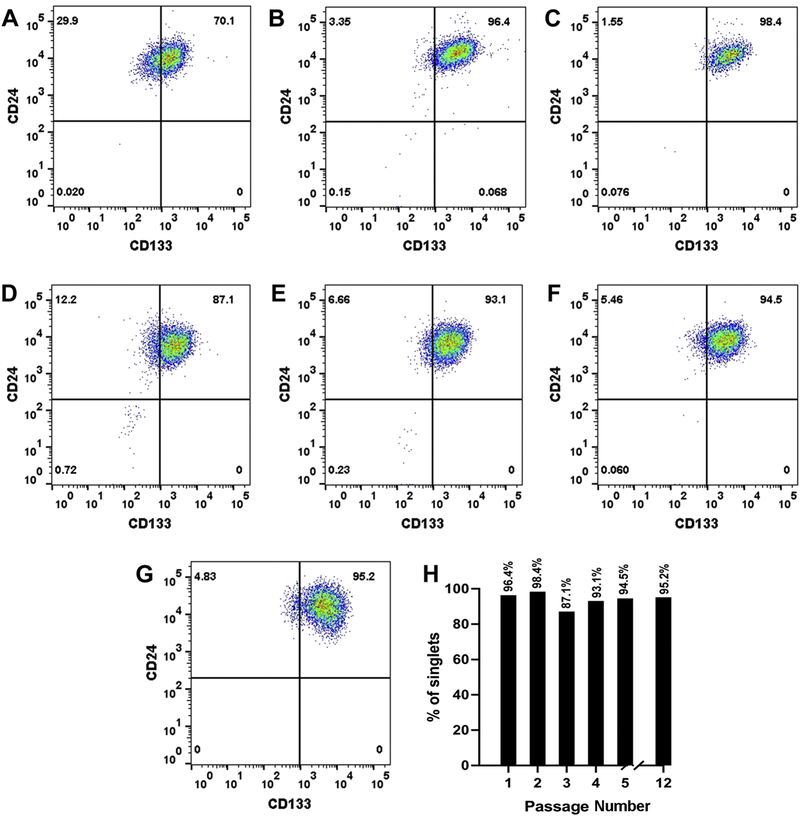
Fig. 1.
Flow cytometry analysis of CD133+ and CD24+ expressing cells. RPTEC/TERT1 cells were sorted based on the expression of CD133 and CD24 markers and the purity of the cells was determined at various passages of cell growth. (A). Analysis of the starting population of CD133+/CD24+ expressing RPTEC/TERT1 cells. (B-G). Analysis of CD133+/CD24+ co-expressing HRTPT cells at passage 1, 2, 3, 4, 5 and 6 respectively. (H). Bar diagram representing the percentage of CD133+/CD24+ expressing cells within the population of HRTPT cells at various passages of culture.

