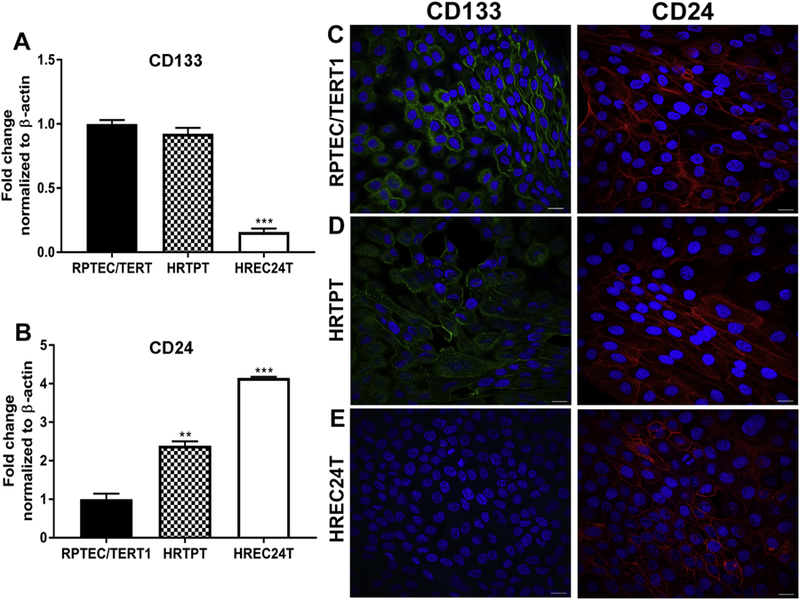
Fig. 3.

Expression of CD133 and CD24 in RPTEC/TERT1, HRTPT and HREC24T cell lines. RT-q PCR analysis of the expression level of (A) CD133 and (B) CD24 in the RPTEC/TERT1, HRTPT and HREC24T cell lines. Analysis was done in triplicates and plotted as the mean ±SD. ** indicates significantly different at a p-value of ≤0.01; *** indicates significantly different at a p-value of ≤ 0.05. (C-E). Immunofluorescent staining showing the localization of CD133 and CD24 in the (C) RPTEC/TERT1, (D) HRTPT and (E) HREC24T cells. Nuclei are stained with DAPI. Scale bar = 25 µm. Magnification x600.
