
Fig. 4.
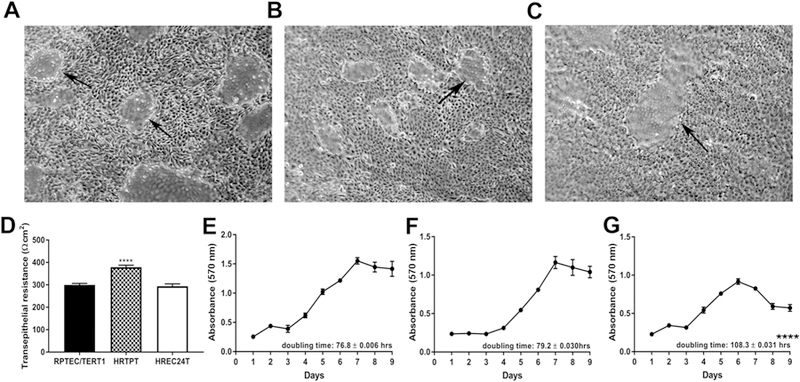
Characterization of the RPTEC/TERT1, HRTPT and HREC24T cell lines. (A-C). Light level microscopy showing the morphology of the (A) RPTEC/TERT1, (B) HRTPT and (C) HREC24T cells at confluency. Arrows indicate the presence of domes, which are indicative of vectorial active transport. (D) Transepithelial electrical resistance (TER) measurements of the RPTEC/TERT1, HRTPT and HREC24T cells. Resistance is expressed as Ohms-cm2. (E-G) Growth rates of the (E) RPTEC/TERT1, (F) HRTPT and (G) HREC24T cells. Doubling times are indicated at the lower right corner of the graph. **** indicates significantly different at a p-value of ≤ 0.0001. Analysis was done in triplicates and plotted as the mean ±SD.