
Figure 1.
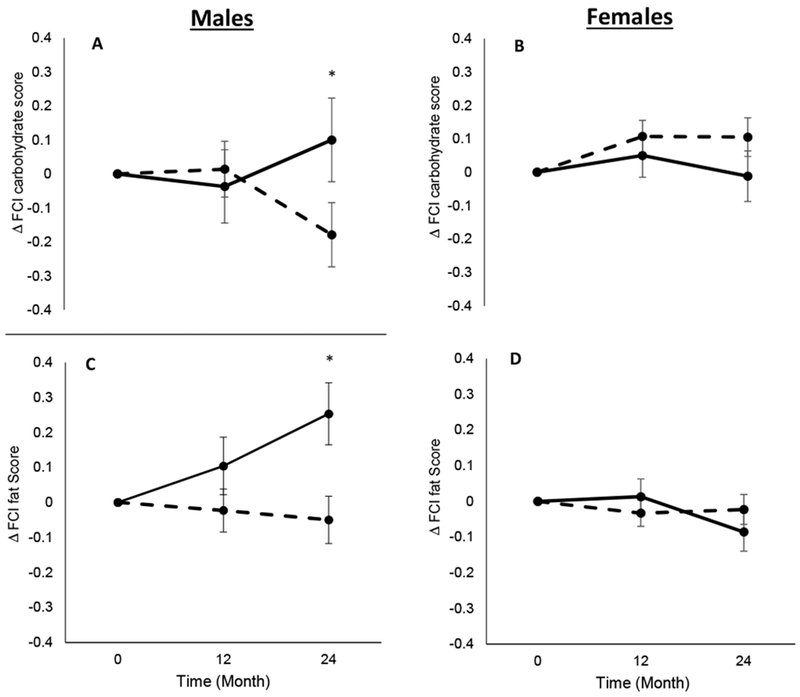
Change in Food Craving Inventory (FCI) carbohydrate score in males (1A) and females (1B), and change in Food Craving Inventory (FCI) fat score in males (1C) and females (1D). Dashed lines represent the calorie restriction (CR) group and solid lines represent the ad libitum (AL) group. * P < 0.05 for sex x treatment x time interaction.