
Figure 2.
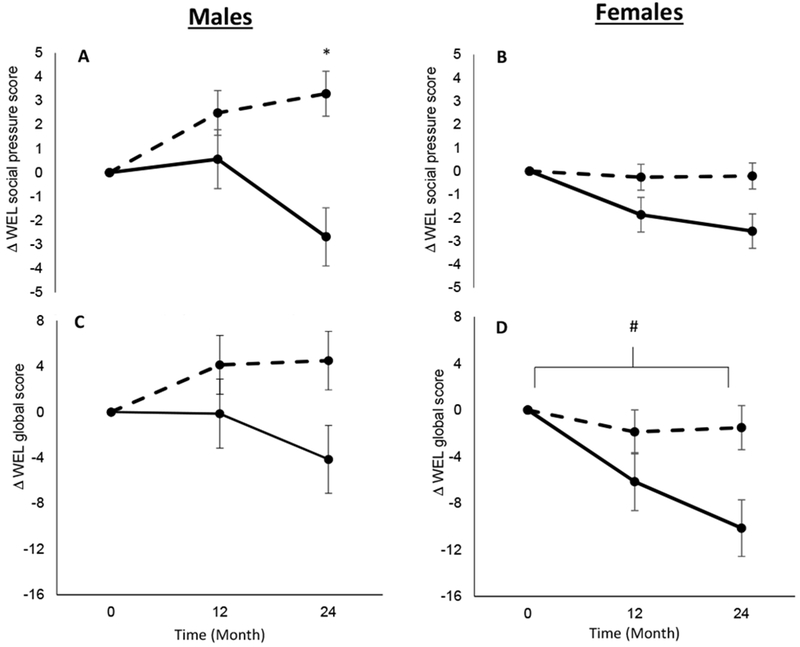
Change in the Weight Efficacy Lifestyle Questionnaire (WEL) social pressure sub-score in males (2A) and females (2B), and change in the Weight Efficacy Lifestyle Questionnaire (WEL) global score in males (2C) and females (2D). Dashed lines represent the calorie restriction (CR) group and solid lines represent the ad libitum (AL) group. * P < 0.05 for sex x treatment x time effect. # P < 0.05 for main effect of sex.