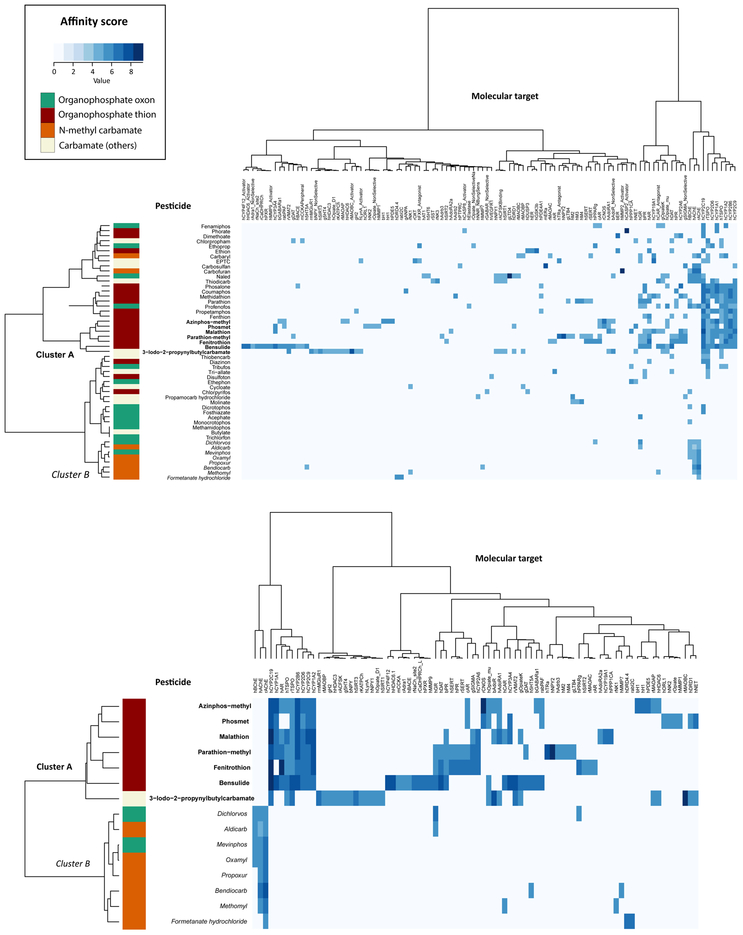
Figure 2A and 2B. Unsupervised two-directional heat map from hierarchical clustering of 32 organophosphates and 19 carbamates across 110 molecular targets.
The heat map was generated with the “gplot” package in R version 3.5.1, using Euclidean distance for measure and Ward’s method for linkage analysis. The intensity of blue color indicates the value of affinity score. Organophosphate (OP) thions are enriched in Cluster A (in bold), which bind to mitochondrial translocator proteins (TSPOs) and cytochrome P450 (CYP) 1A1, 1A2, 2B6, 2C9, 2C19, and 2D6; but not acetylcholinesterases (AChEs) and butyrylcholinesterase (BChE). Another group of 2 OP oxons and 6 N-methyl carbamates bind to the ChEs, but not TSPOs and CYPs (i.e. Cluster B; in italic). For improved visualization of these two groups, Cluster A and B were re-clustered with their 84 molecular targets in Figure 2B. Animal species of these targets are specified by a first-letter initial (b: bovines; g: guinea pigs; h: humans; m: mouse; r: rats; and rab: rabbits) preceding the gene symbol.

