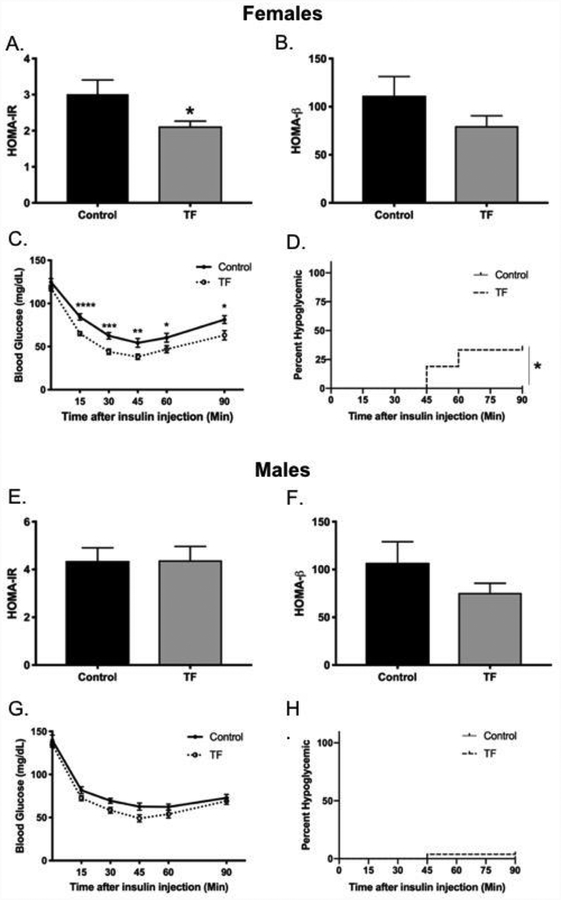
Figure 3. Perinatal TF exposure results in sex-specific differences in insulin sensitivity.
HOMA-IR (Panel A) and HOMA-β (Panel B) were calculated for female offspring using fasting blood glucose and plasma insulin levels at PW10 after a 6-hour fast, (Control n=21, TF n=31). An IP-ITT was performed at PW16 by IP injection of insulin (0.4 U/kg), and serial blood glucose measured for 90 minutes in female offspring (Control n=12; TF n=21) (Panel C). HOMA-IR (Panel E) and HOMA-β (Panel F) were calculated for male offspring using fasting blood glucose and plasma insulin levels at PW 10 after a 6-hour fast (Control n=28; TF n=19). An IP-ITT was performed at PW16 of exposure by IP injection of insulin (0.5 U/kg for males), and serial blood glucose was measured for 90 minutes for male offspring (Control n=15; TF n=26) (Panel G). Survival curves for females (Panel D) and males (Panel H) show the percentage of mice that experienced severe hypoglycemia (<20 mg/dl) during IP-ITT at PW16. ITT, insulin tolerance test. *p<0.05; **p<0.01; ***p<0.001, ****p<0.0001.

