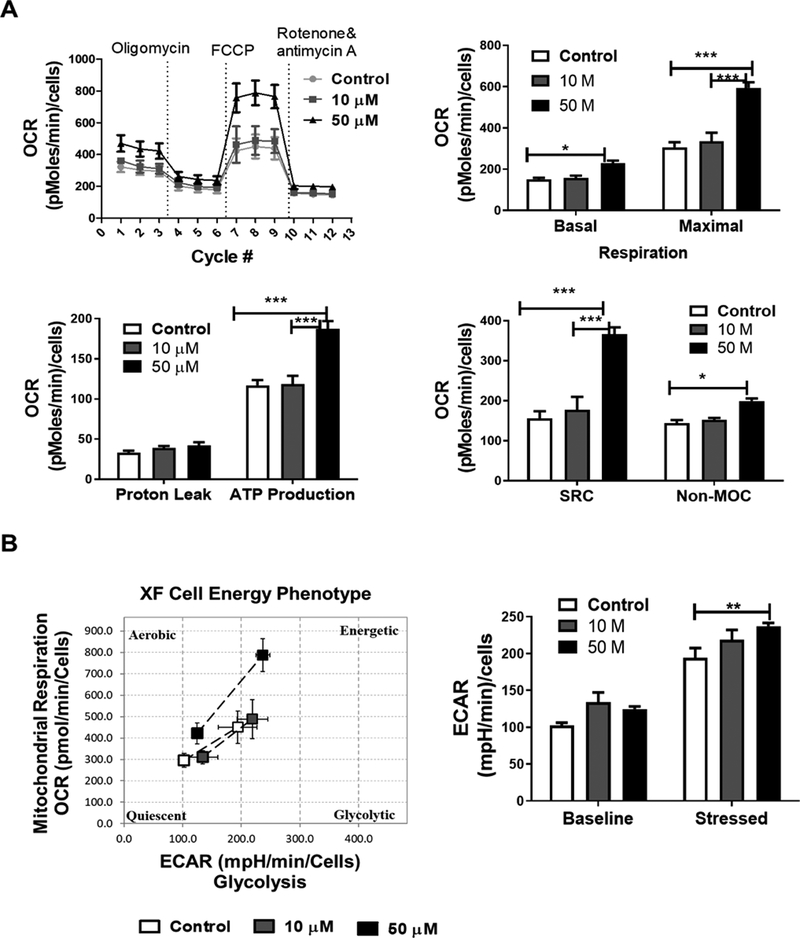
Figure 6. CS increases oxygen consumption rate (OCR) in primary astrocytes.
(A) OCR recordings at baseline and after treatment with oligomycin, FCCP and rotenone/Antimycin A. Bar graphs indicate CS effects on basal and maximal respiration (F2,30 = 47.10, p <0.0001), proton leak and non-mitochondrial oxygen consumption (non-MOC) (F2,30 = 20.9, p <0.0001), as well as ATP production linked to mitochondrial respiration and spare respiratory capacity (SRC) (F2,30 = 50.44, p <0.0001). (B) Cell energy phenotype after treatment of astrocytes with CS. Bar graph indicates the baseline and stressed extracellular acidification rate (ECAR) after CS treatment (F2,30 = 10.01, p =0.0005). Data represented as the mean ±SEM, (Two-way ANOVA, Bonferroni’s test) N= 8 per group, significance at * p< 0.05, * p< 0.01, ***p<0.001

