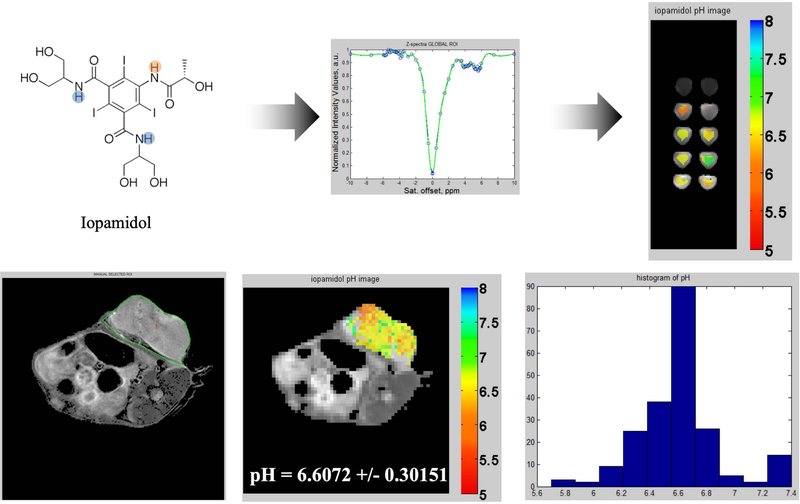
Figure 6.
The top left panel presents the Iopamidol molecule with two pools of 1H highlighted that have different sensitivities to pH. The top middle panel displays the calibration curve z-spectra (blue original, green after B0 correction); note the peaks at 4.2 and 5.5 ppm, corresponding to both pools of protons. The top right panel presents pH maps of 20 mM Iopamidol phantoms. In vivo results are demonstrated in the bottom row of figures via a T2-weighted image of a TUBO tumor in a BALB/c mouse (left panel), a CEST pH map of the tumor (middle panel), and a histogram of the pixels composing the pH map.

