
Figure 1.
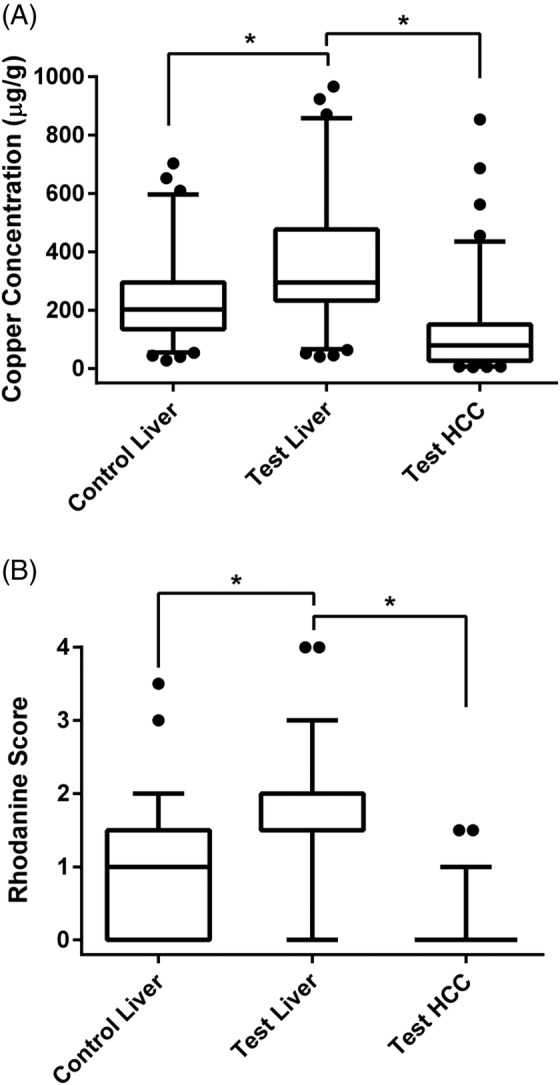
Box and whisker plot depicting copper concentrations (A) and rhodamine scores (B) in test and control population dogs. The horizontal line within each box represents the median; the lower and upper boundaries of each box represent the first and third quartiles; and the whiskers represent the 5th to 95th percentile range. Dots represent individual values outside of this range. Two dogs (1 test liver and 1 control liver) with copper concentrations >1000 μg/g are not depicted in Figure 1A, but they were included in analyses. Control liver, hepatic tissue from control population dogs; Test liver, non‐neoplastic hepatic tissue from test population dogs; Test HCC, neoplastic tissue from test population dogs. *P < .001