
Figure 2.
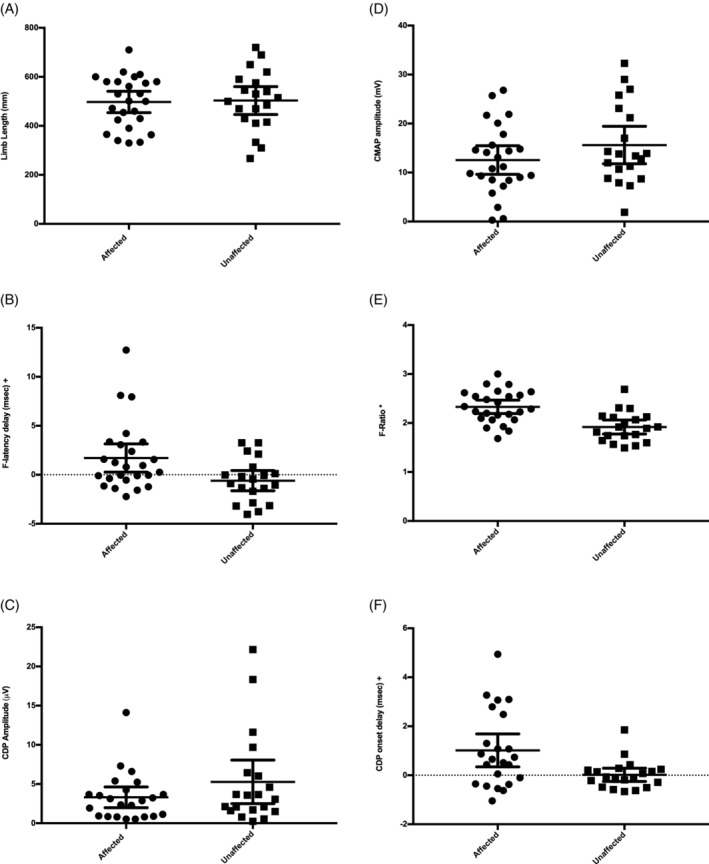
Analysis of continuous data in the study group. The symbol * denotes significant difference with an independent t‐test (P < .05) and the symbol + denotes significant difference with a Mann‐Whitney U test (P < .05). Solid lines represent the means and 95% confidence intervals. The 3 dogs with an F‐latency delay >5 milliseconds in graph C also had CDP onset delays >2 milliseconds