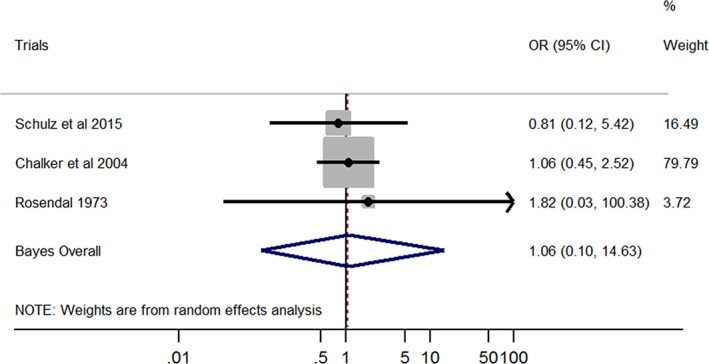
Figure 3.

Forest plot of the association between Mycoplasma canis and lower respiratory tract disease in dogs. Gray boxes represent estimated odds ratios (ORs) for each study; the area of the boxes is proportional to the weight attributed to each study, as determined from random‐effects analysis. Horizontal solid lines represent 95% confidence intervals (CIs). The vertical line represents an OR of 1 (ie, no association). The diamond represents the Bayesian random‐effects pooled OR calculated from all studies included in the meta‐analysis
