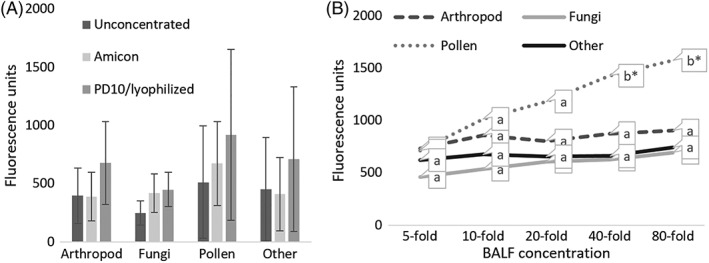
Figure 1.

A, Bronchoalveolar lavage concentration optimization. Average BALF IgE fluorescence results for each protein group demonstrating concentration efficacy for unconcentrated, and concentrated (10‐fold) using either Amicon filter or PD10 columns/lyophilizing, A 1‐way ANOVA for each protein group using a BALF pool from 6 horses (n = 3 SEA; n = 3 control) demonstrated there was no significant difference (p > .05). Means that have no superscript in common are significantly different from each other. B, Average BALF pool horses (n = 3 SEA; n = 3 control) IgE fluorescence results for the main protein groups at various concentrations using Amicon filtration. Groupings included arthropod, fungi, pollen and other; which largely consisted of food and environmental proteins. Significant differences of each protein group were calculated individually by 1‐way ANOVA with Tukey's HSD (* = p < .05). Means that have no superscript in common are significantly different from each other
