
Figure 1.
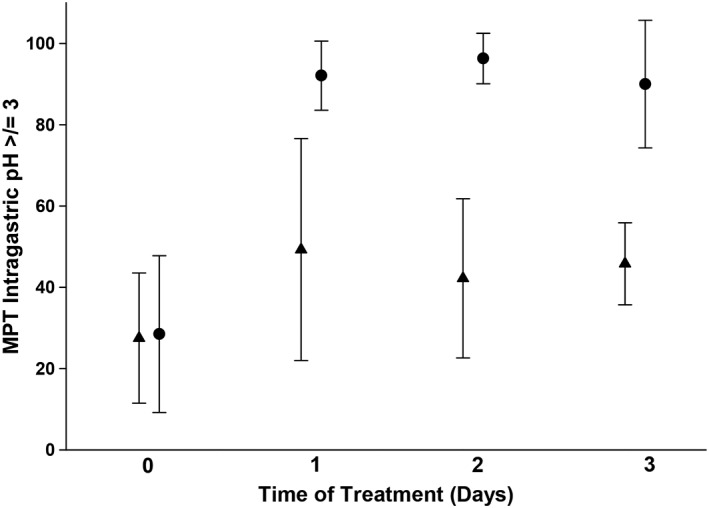
Efficacy of injectable famotidine over time as assessed by mean percent time (MPT) intragastric pH ≥3. Circles represent the MPT ± SD for dogs receiving continuous rate infusion (CRI). Triangles represent the MPT ± SD for dogs receiving twice‐daily IV dosing. There was a statistically significant difference (P < .05) in MPT ≥3 between the CRI and IV q12h groups on all treatment days. Please refer to Table 1 for the number of animals on each day for both treatment groups